
Water Vapor – the Simple Truth
We are learning over time. Driving a bicycle will feel like the most natural, simplistic thing to most of us, but that was not always so. There will have been a time when it appeared an insurmountable challenge. Eventually you would manage driving it, but of course you still felt insecure and awkward. But over time everything settles and you might even learn some stunts.
Dealing with climate physics I had some similar experiences. Insights, even if not fundamentally new, become way more understood and obvious over time. You learn tricks, short cuts, you play around with it, and soon enough the most sophisticated, unfathomable science becomes casual routine. On the other side it looks even weirder when no one else seems to understand it. Let me show you..
It only takes two simple and accessible ingredients to pick apart the whole of “climate science”, it all just comes down to understanding what you are looking at. Exhibit A would be the attribution of the GHE in the version by Schmidt et al 20101, which I have presented a couple of times already.
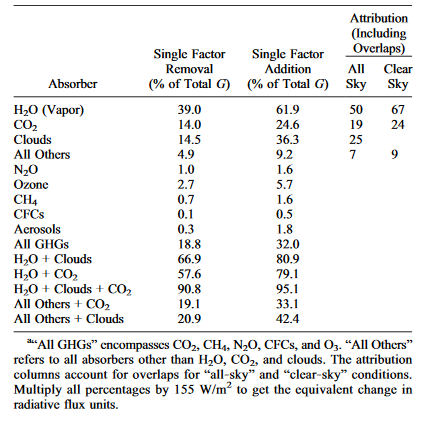
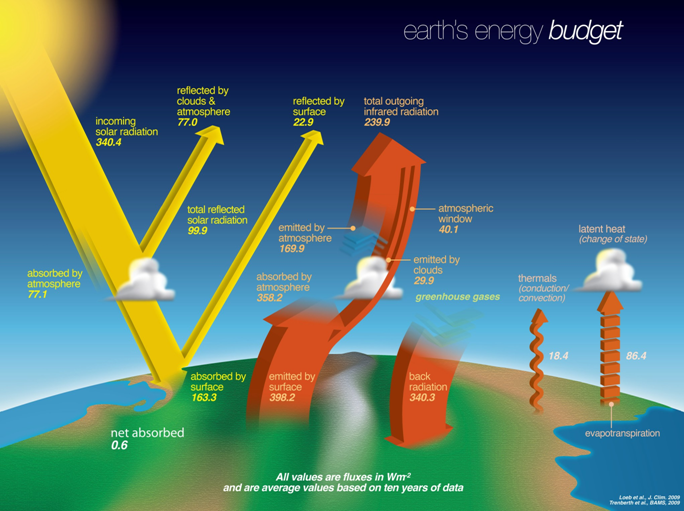
Exhibit B is even more famous – a typical energy budget as you will have seen many times over. These two sources contain almost all the information you need to totally falsify the most fundamental claims of „climate science“, you just need to see what is going on.
I have my issues with both of these sources and a couple of things about them are simply wrong, or at least misleading. However, none of that criticism would negatively affect what I am going to show. So, for this instance, we will just take it as it is.
I want you to take a closer look at clouds and water vapor. Clouds contribute 22.5W/m2 (net) and 56.3W/m2 (gross) to the GHE, according to S10. WV would do 60.5W/m2 (net) and 96W/m2 (gross). You obtain these figures by simply multiplying the percentages with the 155W/m2, given as the total magnitude of the GHE, as named in the subtext to the above table.
The additional information we will need is that on the cloud albedo effect, of some 45 to 50W/m22, depending on the source. S10 for instance names 47.8W/m2. There may be a little confusion here, as the energy budget names 77W/m2 “reflected by clouds & atmosphere”. On the one side the atmosphere itself does scatter and reflect some light, especially beyond the visible range. On the other side the albedo effect is not the same as total light reflected by clouds (back to space), but just the difference that clouds make. A part of the sun light clouds reflect would be reflected by the surface in their absence, especially if the surface is bright, like when covered with snow. This is not counted to the cloud albedo effect, which thus is substantially smaller than the named 77W/m2.
What we get is a simple relation, although it may be too complicated for “climate scientists”. Clouds have a warming effect of 22.5W/m2 and 56.3W/m2 respectively, and a cooling effect of some 47.8W/m2. The cooling is in between the net and the gross warming figure.
Next please look at the right side of the energy budget. There we have “latent heat” of some 86.4W/m2 due to “evapotranspiration”. This cooling is due to water vapor, physically the same thing cooling you when you sweat. A more accurate and reasonable way to portray it, would be showing the effect it has on the lapse rate, thereby shrinking the GHE all over, but it will not matter. Let us restrict ourselves to a “noob” perspective for now, to see what everyone should easily understand.
Recalling the 60.5W/m2 and 96W/m2 figures for the warming effect of WV, we can now put things into perspective. What we get are two pretty simple relations.
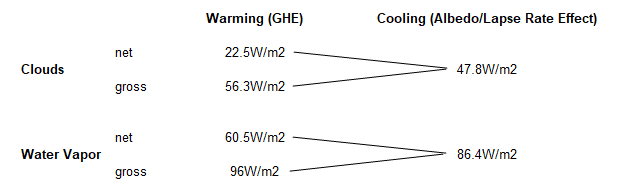
In both instances, be it WV or clouds, we have the very same issue. The cooling momentum is somewhere between the warming effects, net and gross respectively. Really it will not take much expertise to see that. It is beautiful because of its simplicity.
What would you make of it? What would a sane, rational person make of it? Could we possibly agree on equal issues to be treated equally? Sure, we run into the problems I have profoundly discussed here. Whether clouds are cooling or warming will be hard to tell. But whatever you might conclude in this instance, the same will have to be true for WV.
“Climate Logic”
“Climate science” wants you to believe something else:
- For one clouds have to be cooling because their albedo effect exceeds their net warming.
- WV on the other side shall be massively warming because of their large contribution to the GHE, period, do not look at the other side!
This must be the worst magical trick in the history of mankind, even more so given it apparently worked.
Honestly I can not apply Hanlon’s razor here. This is such an obvious problem, it is not thinkable that not at least a couple of “climate scientists”, at least those who are not mere monkeys, whose only job is to push the “run” button on their models, have not realized and discussed it. I am certain they know it, they just do not want you to know! And considering the “critical side”, I am just speechless. I mean if you desperately want to falsify “climate science” and it turns out to be that simple, but you come with all (un)thinkable crap instead, well..
Perspective A
Anyhow, even with this very limited perspective, “climate science” is busted. Water vapor is evidently not, or just barely warming. Even if one argued for a slight warming, because the gross warming exceeds the cooling, then clouds were warming too, causing a chain reaction of issues down the road. But either way, that narrative of a 33K GHE turns instantly obsolete. Sure, you can have the GHE as a theoretical perspective only considering the emission side, not accounting for the cooling effect the two biggest GH-agends also have. But then any line going like..
Without the natural greenhouse effect, the heat emitted by the Earth would simply pass outwards from the Earth’s surface into space and the Earth would have an average temperature of about -20°C3
..will not work anymore. In fact, when you consider that most of the delta between those net and gross figures is due to the overlaps between clouds and WV, it becomes apparent, that they are largely climate neutral. And there are even more perspectives telling the same consistent story.
Perspective B
The non H2O GH constituents in the S10 table amount to 35.8% (=24.6 + 1.6 + 5.7 + 1.6 + 0.5 + 1.8). Bare in mind most overlaps come with clouds and WV, so that those overlaps between the remaining constituents are minimal. Because of it there are just slightly deviating figures for the various aggregates. We can also add up CO2, “all others” and aerosols to 35.6% (=24.6 + 9.2 + 1.8), or “all GHGs” plus aerosols, 33.8% (=32 + 1.8). Multiplied with the 155W/m2 you get around 53W/m2.
Without latent heat, as opposed to the wet lapse rate of some 6.5K/km, the dry lapse rate would be a lot larger, like 10.8K/km. Accordingly the non H2O GH constituents would exert a GHE of 53 * 10.8 / 6.5 = 88W/m2. Even if you assume a 395W/m2 in surface emissions (in reality it is ~360W/m2), you get ~307W/m2 in emissions TOA. That is versus an increased energy budget of 290W/m2, because no clouds. A 17W/m2 imbalance would cool the planet by ~4K, with no WV or cloud feedback to be considered, as neither exist. With accurate surface emissions it will go the opposite way and actually get some warming by removing all H2O from the atmosphere.
Perspective C
We can also play this for WV alone, while keeping the clouds. Sure, physically this makes little sense as WV is the source for clouds, but this is about attribution, not science fiction. The net, or “single factor removal” of vapor is given as 60.5W/m2 and thus 94.5W/m2 (=155-60.5) of the GHE remain. Without latent heat and a steep dry adiabatic lapse rate this will grow to 94.5 * 10.8/6.5 = 157W/m2. The GHE thus would basically stay the same and with a constant energy budget, there is no substantial change in surface temperature. Alternatively you could simply compare the net warming against the latent heat figure and by removing both of which, you would get a warming of 26W/m2 (= 86.4 – 60.5).
Perspective D
Of course there is yet another perspective providing just the same information, that is if you get over some often quoted nonsense..
The estimation is that Earth's blackbody temperature should be 255 K (that is, -18°C). However, the observational data shows Earth's actual average surface temperature is 15°C, 33K warmer than its blackbody temperature.4
According to this “think” Earth was a blackbody with an albedo of 0.3, but of course there is no blackbody with an albedo larger than zero. Calling this the “backbody temperature” is an abuse of terminology. And as so many times over, abusive terminology promotes the misperception of reality. Instead the blackbody temperature of Earth strictly obeys the SB-law and with a solar input of 342W/m2, this results in 278.7K (=342^4*5.67e.8). So the blackbody temperature is ONLY about 9K less than the average surface temperature of Earth.
As I have pointed out, water is indeed a better absorber than emitter (0.94 vs. 0.91), so that the surface of Earth, as it is, would take on a somewhat higher temperature than a blackbody. But let us say that is based on advanced knowledge we can not expect from “critical experts”, thus let us just stick with the plain blackbody temperature. Still then it is true, that the atmosphere only adds about 9K.
This figure fits nicely with all the other perspectives, and it is NOT contradicting the 33K GHE notion. While the GHE is the isolated view on the emission side, a kind of tunnel vision, the bigger picture, considering both sides, just puts things into context. Again, most of the GHE is caused clouds and WV which are equally cooling the planet on the flip side. The agents actually causing some warming are the non-consending GHGs, and their forcing is just about enough to do these 9K.
Perspectives consolidated
So it will not matter how you look at it, with the given “consensus figures” WV is either climate neutral, or cooling. There is not the slightest foundation to assume WV was warming the Earth, let alone causing the bulk of a 33K warming. And all this is self-evident based on “consensus” sources, you just need to add up the numbers.
No positive feedback either
With WV evidently cooling Earth, you would not expect it to be a positive feedback. If the given amount WV is cooling, more of it should cause even more cooling, to name the extravagant logic. And even this could be understood with the most simplistic “consensus science” tools, like modtran.
Just pick the US standard atmosphere scenario (it means to represent roughly the global average), add a temperature offset of 1K and check for the difference it makes whether WV is constant, or allowed to increase according to the Clausius-Clapeyron equation. Within the tool that means “Holding fixed” - “Water Vapor Pressure” or “Relative Humidity”.
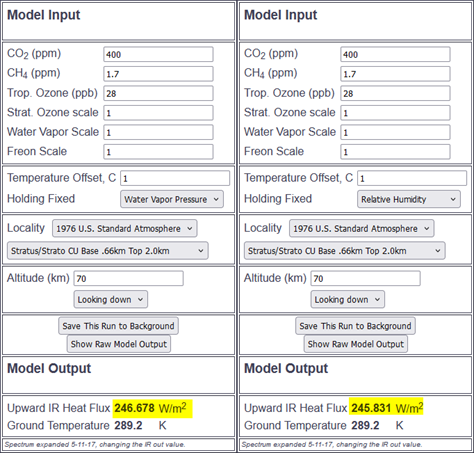
You will get WV feedback of 0.847W/m2 (=246.678 – 245.831) in this instance. This figure is a little too high because the cloud scenario is too weak, the model warms the stratosphere and adds WV there, despite it will be cooling with an increment of CO2, and the model overstates WV in general. Most of all however, modtran does not adapt the lapse rate. The whole latent heat / lapse rate issue is not getting addressed. In AR45 the central estimate for the negative lapse rate feedback was -0.84W/m2:
In AOGCMs, the water vapour feedback constitutes by far the strongest feedback, with a multi-model mean and standard deviation for the MMD at PCMDI of 1.80 ± 0.18 W m–2 °C–1, followed by the (negative) lapse rate feedback (–0.84 ± 0.26 W m–2 °C–1)
Even if you know nothing else, you would instantly understand how WV can not be a positive feedback, let a lone a massive one, a detail the global warming narrative totally depends on. And it is a consistent picture, embedded in a multitude of perspectives all telling the same story.
Oh dear..
It is darn simple, crystal clear, and totally effective in destroying the whole “consensus science”. By no means you would need my level of education, or anything near it. An interested layman, just looking up some materials, could easily do it. Instead however we get something like in the graph below, taken from a certain Lynn Balzer on Tom Nelson’s podcast.6
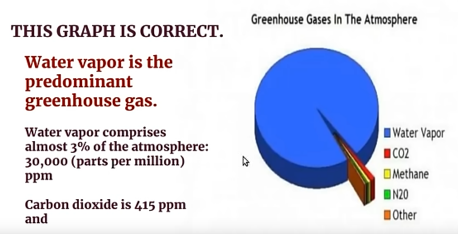
First of all it is factually wrong. Water vapor makes up for about 0.4% of the atmosphere, or ~4000ppm. Equally, since H2O is relatively lighter than the other molecules, these are 0.25% of the atmospheric mass. The 3% claimed here is true for the air close the surface in the moist, warm inner tropics, and only there. But hey, who cares? The other thing is that the forcing by GH-constituents can not be measured by their concentration, just like it makes little sense to equate 10 ants with 10 elephants. I do understand the notion though. If you blame all the GHE on WV, then somehow you could exonerate CO2, because it looks so negligible by comparison. A lot of “climate deniers” argue like this.
It is like a penalty in football. But just to make things easier, the keeper leaves and the spot is moved closer to the goal, like one meter in front of it. Then our dedicated “climate critics” take an extra long effort and kick the ball perfectly - in the opposite direction! It seems too stupid to be possible, and yet..
Water vapor may be considered a GHG, circumstantially, but it is not the warming the planet, nor is it a powerful positive feedback. Seeing this is not complicated, and pointing it out would make a “critical” argument on solid ground. I am pretty certain, if you argue it correctly, there would not even be much resistance by the established “consensus science”, because they know they can not win the argument. Rather, feeling exposed, they would go into hiding. There are tipping points in social conflicts, because no one wants to be on the losing side. But so far “climate science” can quote this famous line from the Ukrainan army: “We are lucky they are so f****** stupid”.
Disclaimer:
This article is not “state of the art”, rather is supposed provide a simplified look on fundamental climate physics. Neither does it represent the highest level of knowledge, otherwise provided here. Instead it quotes common “consensus narratives”, despite being often inaccurate or even straight forward wrong, to show how even these offer great opportunity for fundamental falsification. Profound knowledge is not necessarily required to do that.
If you are interested in the more sophisticated aspects of climate physics, go and check previous articles on the respective questions.
Comments (3)
noGlobal
at 18.02.2025excelent post like always.
there is something i don't undertand from your first figure warming & cooling. You mix warming data from table 1 (i asume is troposphere) with cooling data from table 2, that is for ToA. But in table 2 you already have the warming and cooling data for ToA. Why don't you use both from there?
Regards
GHD
at 21.02.2025https://greenhousedefect.com/the-holy-grail-of-ecs/vapor-feedback-ii-the-lapse-rate-and-the-feedback-catastrophe
LOL@Klimate Katastrophe Kooks
at 13.12.2025https://i.imgur.com/QErszYW.gif
[1] Idealized Blackbody Object form (assumes emission to 0 K and ε = 1 by definition):
q_bb = ε σ (T_h^4 - T_c^4)
= 1 σ (T_h^4 - 0 K)
= σ T^4
For an idealized blackbody object, radiant exitance (q) is directly proportional to the fourth power of its absolute temperature (T), described by the Stefan-Boltzmann Law: q = σ T^4
[2] Graybody Object form (assumes emission to > 0 K and ε < 1):
q_gb = ε σ (T_h^4 - T_c^4)
This is how climatologists conjure "backradiation" out of thin air by misusing the S-B equation in their Energy Balance Climate Models (and in their pyrgeometers and similar such equipment used to 'measure' "backradiation"):
https://i.imgur.com/V2lWC3f.png
Climatologists misuse the S-B equation, using the idealized blackbody form of the equation upon real-world graybody objects. This essentially isolates each object into its own system so objects cannot interact via the ambient EM field. It assumes emission to 0 K, and it thus artificially inflates radiant exitance of all calculated-upon objects. Thus the climatologists must carry these incorrect values through their calculations and cancel them on the back end to get their equation to balance, subtracting a wholly-fictive 'cooler to warmer' energy flow from the real (but too high because it was calculated for emission to 0 K) 'warmer to cooler' energy flow.
That wholly-fictive 'cooler to warmer' energy flow is otherwise known as 'backradiation'. It is nothing more than a mathematical artifact due to the misuse of the S-B equation. It does not and cannot exist. Its existence would imply rampant violations of the fundamental physical laws (energy spontaneously flowing up an energy density gradient in violation of 2LoT).
The climatologists know that "backradiation" is physically impossible, thus their "greenhouse effect (due to backradiation)" is physically impossible... but they had to show it was having an effect, so they hijacked the Average Humid Adiabatic Lapse Rate.
We know the planet's emission curve is roughly analogous to that of an idealized blackbody object emitting at 255 K. And we know the 'effective emission height' at that temperature is ~5.105 km.
High Humidity Adiabatic Lapse Rate:
3.5 K km-1 * 5.105 K = 17.8675 K atmospheric temperature gradient + 255 K = 272.8675 K surface temperature
Average Humid Adiabatic Lapse Rate:
6.5 K km-1 * 5.105 km = 33.1815 K atmospheric temperature gradient + 255 K = 288.1815 K surface temperature
Dry Adiabatic Lapse Rate:
9.8 K km-1 * 5.105 km = 50.029 K atmospheric temperature gradient + 255 K = 305.029 K surface temperature
Thus, water vapor has a negative feedback of from 16.8475 K to 32.1615 K, depending upon water vapor concentration of the atmosphere.
That 6.5 K km-1 is the Average Humid Adiabatic Lapse Rate. That 33.1815 K temperature gradient and 288.1815 K surface temperature is what the climatologists try to claim is caused by their "greenhouse effect (due to backradiation)"... except it's not. It's caused by the Average Humid Adiabatic Lapse Rate, and that has nothing to do with any "backradiation", nor any "greenhouse effect (due to backradiation)", nor any "greenhouse gases (due to the greenhouse effect (due to backradiation))".
The Adiabatic Lapse Rate is caused by the atmosphere converting z-axis DOF (Degree of Freedom) translational mode (kinetic) energy to gravitational potential energy with altitude (and vice versa), that change in z-axis kinetic energy equipartitioning with the other 2 linearly-independent DOF upon subsequent collisions, per the Equipartition Theorem. This is why temperature falls as altitude increases (and vice versa).
In short, the climatologists have misattributed their completely-fake "backradiation" as the cause of the atmospheric temperature gradient which is actually caused by the Adiabatic Lapse Rate and its associated gravitational auto-compression (the blue-shifting of temperature as one descends a gravity well in an atmosphere).
We cannot have two simultaneous but completely different causes for the same effect (one radiative energy... the wholly-fictive "greenhouse effect (due to backradiation)"; and one kinetic energy... the Adiabatic Lapse Rate). If we did, we'd have double the effect. One must go. And the one which must go is the mathematically-fraudulent "greenhouse effect (due to backradiation)".
That leaves only the Adiabatic Lapse Rate. And we can calculate the exact change in temperature gradient (and thus surface temperature) for any given change in concentration of any given atmospheric gas.
For instance, the "ECS" (ie: the change in Adiabatic Lapse Rate) of CO2 is only 0.00000190472202445 K km-1 ppm-1 (when accounting for the atoms and molecules which CO2 displaces).
This means the sum total effect of the atmospheric CO2 concentration change from pre-industrial times (~280 ppm) to present (~430 ppm) is 0.0014585408902 K.
Further, the climatologists claim that water vapor is the most effective "greenhouse gas (due to the greenhouse effect (due to backradiation))".
Except water is such an effective net atmospheric radiative coolant that it acts as a literal refrigerant (in the strict ‘refrigeration cycle’ sense) below the tropopause:
The refrigeration cycle (Earth) [AC system]:
A liquid evaporates at the heat source (the surface) [in the evaporator], it is transported (convected) [via an AC compressor], it gives up its energy to the heat sink and undergoes phase change (emits radiation in the upper atmosphere, the majority of which is upwelling owing to the mean free path length / altitude / air density relation and the energy density gradient) [in the condenser], it is transported (falls as rain or snow) [via that AC compressor], and the cycle repeats.
That’s kind of why, after all, the humid adiabatic lapse rate (~3.5 to ~6.5 K km-1) is lower than the dry adiabatic lapse rate (~9.8 K km-1).
Further, note that the much higher Dry Adiabatic Lapse Rate case is one in which the atmosphere consists ~99.957% of N2 (a homonuclear diatomic), O2 (a homonuclear diatomic) and Ar (a monoatomic).
Monoatomics have no vibrational mode quantum states and thus cannot emit (nor absorb) IR in any case. Homonuclear diatomics have a net-zero electric dipole which must be perturbed (usually via collision) in order to emit (or absorb)... except collisions occur exponentially less frequently with altitude due to air density decreasing exponentially with altitude.
Remember that an actual greenhouse works by hindering convection of energy out of the greenhouse.
In an atmosphere consisting of solely monoatomics and homonuclear diatomics (ie: no polyatomic radiative molecules), the atoms / molecules could pick up energy via conduction by contacting the surface, just as the polyatomics do; they could convect just as the polyatomics do… but once in the upper atmosphere, they could not as effectively radiatively emit that energy, the upper atmosphere would warm, lending less buoyancy to convecting air, thus hindering convection… and that’s how an actual greenhouse works, by hindering convection.
If the starting point of the Adiabatic Lapse Rate (in the upper atmosphere) warms (as would be the case above), that must translate down through the lapse rate to result in a warmer surface. We empirically observe this on a very dry day in a desert region.
For homonuclear diatomics, there would be some collisional perturbation of their net-zero electric dipole and thus some emission in the atmosphere, but by and large the atmosphere could not effectively emit (especially at higher altitudes, because the probability of collision decreases exponentially with altitude).
Because, in the case above where the atmosphere had no radiative polyatomics, that 76.2% of all energy incident upon the surface would no longer be removed by the polyatomics, convected higher into the atmosphere, then radiatively emitted down the energy density gradient and out to space, the surface would have to radiatively emit that energy instead… and a higher surface radiant exitance implies a higher surface temperature per the S-B equation.
https://www.patriotaction.us/showthread.php?tid=2711
In short, the whole of AGW / CAGW is nothing more than a complex mathematical scam. It describes a physical process which is provably physically impossible.