

The beast under the bed part 2
In the first part of this article we learned the concept of the cloud radiative effect is based on a blunder, underestimating the significance of clouds and overstating that of GHGs. Here in the 2nd part we going to sort out how this plays out in the real world.
Alright, so we need to recapitulate what we have learned so far. Starting out with the bogus claim of GHGs providing some 33K (equivalent to 150W/m2) to the surface temperature of Earth, we had to find it is based on improper simplifications. Clouds are not GHGs and the surface is not even close to being a perfect emitter. Both insights combined have a huge impact on the GHE, or rather the GHGE (GHG-effect). It has morphed from a 150W/m2 to only 85W/m2. So that this..

has turned into this..

It is both a revolutionary but also trivial insight. All that should be undisputed basics of climate science if people cared more about physics than politics. Yet, as we had to learn in the first part of this article, even the latter representation contains a huge blunder. The "GHEs" of clouds and GHGs are significantly overlapped and given the current policy this part is entirely allocated to GHGs, which is obviously wrong. The crucial question here is what the real long wave cloud radiative effect (LWCREr) is (as opposed to the LWCFEf of ~30W/m2, with f for false or fake), and how large the overlapped component is.
There are different possible approaches to estimate the LWCREr, but since "climate science" has been blind on this issue all over, there is no available literature on the subject to my knowledge. Rather we will have to develop it all from scratch and again, do some pioneering work, which is exciting on its own. And as the previously presented modtran data showed, we are not totally clueless.
Since the GHE is a function of emission altitude and lapse rate (not "back radiation"!), this logic will also apply to the LWCREr. The higher up a cloud, the stronger the LWCREr. Other factors will logically be cloud abundance and opacity. Additionally the lapse rate shows significant variations over the globe, with the polar regions having a strong inversion over winter time. There and then low clouds even increase emissions, as they are simply warmer than the surface below them. Another relevant question is on cloud emissivity, which again and unsurprisingly is insufficiently researched. I mean why would you care about real cloud emissivity, if you happen to ignore surface emissivity and the other pressing issues pointed out here.
If we had all the data on cloud top altitude, opacity, emissivity and the respective lapse rates, then it should be possible to derive LWCREr from it. It might be a complex undertaking, but certainly a possible one. Yet it goes beyond my capabilities and so all I could do is to assume one uniform lapse rate of 6.5K per 1.000m altitude and place some opaque cloud tops at the respective altitudes. For instance, totally simplified, we could assume 50% of the planet was covered by clouds with opaque tops at 5.000m, that is with a temperature of 288 - 5x6.5K = 255.5K. Then, wrongly assuming a perfect emissivity for both clouds and surface, the surface would emit 195W/m2 (=0.5 * 390) directly into space, and the cloud tops 120.8W/m2 (= (255.5/288)^4 * 390 * 0.5). The LWCREr would then be 390 - 195 - 120.8 = 74.2W/m2.
Now obviously that is not a proper result, rather it is only a scheme, but one you can play around with, making it more complex, going through different assumptions and scenarios. What I get is a "cloud" of thinkable results somewhere in the 60-100W/m2 range.
Another hint are the empiric data which we partially discussed already. All these data clearly suggest a positive NCRE, so that the LWCREr > SWCREr. Again, we have the same redundancy issue with the SWCRE, though the overlapped component is much smaller there. There certainly are a lot of questions left to be explored around this complex.
The most reasonable and comprehensible approach however is likely to simply exploit the modtran model, also because we already dealt with it. As shown it is relatively easy to determine both LWCREr and LWCREf for any represented cloud scenario by simply switching GHGs on and off. Since these cloud scenarios are strict and simplified, there is no way we could draw reasonable conclusions straight forward. However we can investigate the relation of LWCREr to LWCREf for all the different scenarios, make an estimate on what that relation in the real world might be, and combine this information with the 30W/m2 of LWCREf the IPCC claims.
If have no choice but to present some data at this point, so let us go through it step by step. Let us first look at the different cloud scenarios optional within the model and how they impair emissions with the given preset of GHGs. Figures are in W/m2.
| trop | mid S | mid W | subarc S | subarc W | USA std | |
| No | 298.52 | 289.60 | 235.22 | 270.73 | 202.06 | 267.84 |
| Nimbo .66km | 292.65 | 284.99 | 231.58 | 264.45 | 206.99 | 259.27 |
| Strat 1km | 288.38 | 281.72 | 228.81 | 260.37 | 205.20 | 253.87 |
| Strat 2km | 280.43 | 273.62 | 223.35 | 251.92 | 199.77 | 242.91 |
| Cum 2.7 | 269.82 | 260.37 | 214.09 | 240.81 | 192.01 | 228.88 |
| Alto 3km | 269.00 | 259.62 | 213.39 | 240.18 | 191.48 | 228.09 |
| Cirrus std | 277.55 | 271.77 | 223.38 | 259.05 | 196.85 | 249.22 |
| Cirr NOAA | 279.68 | 273.68 | 224.89 | 260.62 | 198.10 | 251.14 |
As to be expected the higher up clouds are, the more they reduce emissions. The exception would be cirrus clouds which are largely transparent. Also low cloud tops in cold climate do even increase emissions. Essentially it is all very consistent with what I explained before. With altitude come lower temperatures and that means less emissions.
Next let us look up the data for a zero GHG situation and by how much clouds will impair emissions then.
| trop | mid S | mid W | subarc S | subarc W | USA std | |
| No | 443.68 | 412.60 | 303.36 | 374.92 | 242.31 | 380.25 |
| Nimbo .66km | 419.82 | 397.52 | 294.94 | 356.08 | 254.69 | 356.39 |
| Strat 1km | 403.80 | 386.85 | 288.06 | 343.83 | 250.57 | 341.63 |
| Strat 2km | 379.31 | 363.61 | 275.44 | 321.22 | 239.11 | 314.63 |
| Cum 2.7 | 352.31 | 331.27 | 256.22 | 294.72 | 224.26 | 283.42 |
| Alto 3km | 350.74 | 329.70 | 255.00 | 293.46 | 223.35 | 281.97 |
| Cirrus std | 402.86 | 378.06 | 282.69 | 350.11 | 233.65 | 345.71 |
| Cirr NOAA | 406.63 | 381.20 | 285.05 | 353.25 | 235.56 | 348.85 |
Now we can directly compare LWCREf to LWCREr. We simply use the no cloud figures as a base, take the difference with the respective cloud scenarios to obtain LWCREf and LWCREr and divide the latter by the first. It is the same procedure we used in the first part, just that this time we apply it on all possible scenarios.
| trop | mid S | mid W | subarc S | subarc W | USA std | |
| Nimbo .66km | 4.06 | 3.27 | 2.31 | 3.00 | 2.51 | 2.78 |
| Strat 1km | 3.93 | 3.27 | 2.39 | 3.00 | 2.63 | 2.76 |
| Strat 2km | 3.56 | 3.06 | 2.35 | 2.85 | 1.40 | 2.63 |
| Cum 2.7 | 3.18 | 2.78 | 2.23 | 2.68 | 1.80 | 2.49 |
| Alto 3km | 3.15 | 2.76 | 2.22 | 2.67 | 1.79 | 2.47 |
| Cirrus std | 1.95 | 1.94 | 1.75 | 2.12 | 1.66 | 1.85 |
| Cirr NOAA | 1.97 | 1.97 | 1.77 | 2.14 | 1.71 | 1.88 |
The lower any cloud layer is, the more it is overlapped with GHGs, especially vapor of course, which itself is concentrated at lower altitudes. Also vapor is more abundant in a warm climate. So it is no surprise we get the largest LWCREr to LWCREf ratio (4.06) with a nimbostratus cloud top of only 0.66km in the tropics. On the other extreme we have cirrus clouds where the ratio sinks just below 2. In reality the global average ratio, which essentially depending on cloud altitude, must be somewhere between the Altostratus 3km and the Cirrus cloud scenarios.
To get a better handle on this, I am averaging these results (excluding the US standard model) by weighting the respective climate zones according their global share, averaging the winter and summer scenarios, and allowing for typical temperatures within these zones. It seems way to trivial to discuss all the details, so let us jump right to the results.
| LWCREr/LWCREf | |
| Nimbo .66km | 3.50 |
| Strat 1km | 3.44 |
| Strat 2km | 3.13 |
| Cum 2.7 | 2.86 |
| Alto 3km | 2.83 |
| Cirrus std | 1.91 |
| Cirr NOAA | 1.93 |
Eventually, from here on, it is a bit of a guessing game. It is safe to say that cirrus clouds will strongly underrepresent the ratio, as they are a lot higher than average cloud tops. The altostratus 3km scenario on the other side will overrepresent it. A proper assessment should be somewhere in the middle, though a lot closer to the altostratus figure. If I choose 2.6 as a ratio and apply it to the 30W/m2 of LWCREf, then the LWCREr should be around 80W/m2. I know, it is no way perfect, but consistent with the other approaches and given the circumstances it is a fair guess. Reality will not be too far off. But most of all, it provides us a figure we can work with. And of course I can only call to more accurate research on this subject matter.
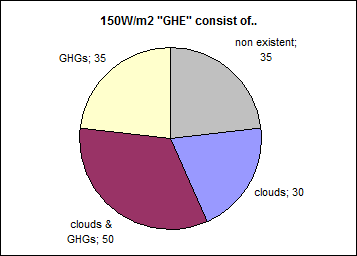
Anyhow, that is where we get to the delicious part, because now we can draw a far more accurate emission diagram. Clouds, GHGs and aerosols (which we ignore for convenience) reduce emissions by a total of 115W/m2. Of that clouds hold an exclusive share of 30W/m2, according to the current state of "climate science". We know by now, that the approach of comparing all sky to clear sky emissions is illicit for determining LWCRE, and so we call this part LWCREf. The LWCREr is significantly larger and strongly overlapped with GHGs. Assuming it will amount to ~80W/m2, the overlapped component will be 50W/m2 in size and the GHG exclusive share shrinks to an unimpressive 35W/m2.

As the chart suggests, cloud and GHGs are about equally potent greenhouse factors on the emission side, which is a huge insight on its own. The consequences are even more severe if we consider the common counterfactual statement "without GHGs Earth would be...". Obviously a lot of serious consequences were to be expected if there were no GHGs, most of all the suffocation of all plant life and the extinction of most other life with it. Also it would be hard to imagine clouds without vapor feeding them. However it is important to understand, such counterfactual assumptions are not meant to portray a fictional world, but are only meant to sort out causation within the given real world. So if we follow the simple logic which is usually applied to the notion, meaning ceteris paribus (if factually possible or not), then without GHGs emissions would only be 35W/m2 higher. And that figure translates into a GHGE of only 7K!
Actually that is a bit unfair, since the largest part of the GHGE lies within the redundant component and we must not deny the fact that GHGs contribute to it. It is the same issue "climate science" has with clouds by denying their contribution to the redundant component. I mean you do not want overthrow a bad regime just to replace with an equally bad one, and we are not going to make this mistake. About 50W/m2 are of GHE are due to GHG AND clouds, and we can not possibly split it up. However for the counterfactual assumption that all GHGs disappeared from one instance to another, then emissions would indeed only increase by about these 35W/m2.
The insight neither denies the GHE, nor would it suggest GHGs play no role in Earth's climate. Yet is so distinctly different from the simple, stupid narrative "climate science" and IPCC are propagating. After swallowing just three basic red pills and a couple of supplementary ones, the world of climate science looks all so different. Essentially all the basics of climate projections are gone, and that is gone for good. The reality of the GHE differs so severely from the fiction climate models are based on, that they are necessarily flawed beyond repair. It is not about if climate models are accurate or not and the lasting discussion hereto, but the fact they can not work. Even if they got it right by occasion, it would be purely incidental.
But that is only what we know for now. Who knows what the future holds?
Comments (0)
No comments found!