
Contrails – A Forcing To Be Reckoned With
When it comes to alternative explanations for “global warming”, most climate skeptics are inclined to point to the sun. It makes sense in a way, as the GHE is responsible for a certain deviation in surface temperature, while the sun is responsible for the bulk of it. Without the sun, if Earth was a rogue planet, the surface temperature would be close to zero Kelvin. So in a way the sun is the gorilla in the room, and it would be foolish to ignore it when it comes to natural climate change. Also we know the sun is prone to cycles, though because of the infancy of civilization and modern day astrophysics, we have only had a very short glimpse on them. Most of the potential variation of solar intensity remains uncharted land, which leaves plenty of room for speculation.
Now if this was a law suit where “reasonable doubt” was a criterion, such arguments might bring a winning point. Since it is not, and solar activity seems unable to explain recent five decadal warming, such reasoning appears somewhat odd. Rather we would want to have something more tangible and less speculative. So, is there something?
First let me recapitulate how CO2 can not possibly be the cause of recent warming. With an ECS of only about 0.45K for a doubling on CO2, we need to consider that a) we are no way near to even doubling it, and b) ECS is a theoretical temperature gain in the long run, when things should eventually be perfectly balanced (which they never are). CO2 might have contributed some 0.1 to 0.15K to global warming, and including CH4 (methane) it might even be 0.2K. Although not totally negligible, it would be hard to even detect a signal in global temperature records of this magnitude, given a substantial natural variation.
Also I have to emphasize this result is not “a thing” with modtran, or spectral line analysis as such, but is indeed far deeper rooted in the misconception of the GHE itself. As with previously disussed Schmidt et al 20101 the SFR (single factor removal, "net") figure of all GHGs combined would amount to 63.7% of a GHE of 155W/m2. The figure is not explicitly named, but logically follows by subtracting the SFA (single factor addition, "gross") of clouds (36.3%) from a total of 100%. Accordingly all GHGs combined would add a net total of 98.7W/m2 to the GHE, and any change in their concentration would alter this figure, whereby we naturally focus on an increase of it.
The S2010 figures deviate from reality on two essential accounts, as a) it assumes a surface emissivity of 1 and surface emission >390W/m2, while indeed they are only ~355W/m2, thereby overstating the GHE by some 40W/m2. This error margin directly affects the inferred SFR of GHGs. The other issue b) is in understating the CRE (cloud radiative effect) with 22.5W/m2 SFR and 56.3W/m2 SFA. More likely these figures should be 30W/m2 and 75W/m2 respectively. It then follows the SFR of all GHGs is only about 40W/m2 (115-75), or only ~40% of what S2010 assumes, and the whole orthodoxy with it.
Important: this difference, this massive reduction in the SFR of GHGs, is not derived from spectral line calculators, but independently determined. It is the basis and spectral line results are only mirroring this essential issue. In this way we not just have independent confirmation on the ECS correction, but we can also understand how “climate science” got it all wrong from the get go.
What about contrails?
Contrails are a human factor causing global warming. According to the IPCC however, this contrail effect was essentially negligible.
The current best estimate for the RF of persistent linear contrails for aircraft operations in 2000 is +0.010 W m–2
The +0.010 W m–2 value is also considered to be the best estimate for 2005 because of the slow overall growth in aviation fuel use in the 2000 to 2005 period2
Temperature wise a forcing of 0.01W/m2 would mean almost 0.003K, excluding feedbacks, which again is nothing. The above is from AR4 and all over this question obviously had low priority. With AR6 the IPCC tries to be a bit more consistent. In annex III a table provides an estimate of 0.06W/m2 in contrail cirrus ERF for the year 2019, gradually increasing since 1960, when it was 0.01W/m2. On its own, this looks like a notable increase versus the previous estimate, but one needs to consider the (lack of) definition of “linear contrails” as opposed to any broader definitions.
It does not really matter, since even a forcing of 0.06W/m2 is not going to make a material difference, as it would amount to only 3% of CO2 forcing, and 2% of total anthropogenic forcing. So yes, contrails contribute to global warming, but they obviously play a minor role, and more importantly, a non-lasting one. So why would I even mention them?
How about a second opinion?
This result shows the increased cirrus coverage, attributable to air traffic, could account for nearly all of the warming observed over the United States for nearly 20 years starting in 19753
So there is a slightly different position, according to which contrails would not just contribute a tiny little share, but essentially all?! Of course today, with all the fake news and “bad information”, such antagonistic claims are omnipresent and must be flagged accordingly. In this instance the source is a conspiracy theorist, climate denialist splinter cell called NASA! I am not making this up, and although the paper is a couple of years old, NASA was indeed suggesting contrails could be the main driver of global warming.
Sure the article is carefully adding this would not contradict the CO2 hypothesis, as “it is important to acknowledge contrails would add to and not replace any greenhouse gas effect”. The argument is lacking though, since if almost all warming was due to contrails, there is simply little left for CO2. The statement is heretic anyway.
I mean if there is a chance global warming was due to contrails, rather than CO2, that should raise more than just some eye brows. One of the “strongest” arguments for the CO2 narrative is in the apparent lack of alternative explanations. It is the one pillar, so to say, of the theoretical framework, according to which CO2 emissions must cause global warming. The other pillar is the materialization of the prophecy in the shape of growing temperatures. It is all so comprehensible. The consensus science here, the empirical evidence there, and it all fits like a glove. Almost.
What may seem solid superficially, quickly erodes once we take a closer look. First of all temperatures have only two directions to go, up or down. The fact that they are going up thus provides little evidence. A more accurate criterion would be how much warming there is, and without going into the details of what would be a lengthy discussion, climate models have been predicting some 0.23 to 0.34K per decade. Temperature records on the other side only show about 0.18K, with the UAH record, the one that has not been “optimized” to account for lacking warming, currently at 0.135K. That is only half of the predicted warming, nothing to support the theory. Even then models which predicted less warming and thus were closer to reality, were largely based on too “optimistic” low emission pathways that did not materialize (like Hansen’s scenarios B & C).
Once we dive deeper, we find out about an almost endless number of flaws both in the GHE theory, as well as the specific role CO2 is supposed to play. As I am dealing with these all over the site, there is little need to repeat them here. In short, CO2 should be contributing a little bit to the warming trend there is, but the bulk of it is otherwise unaddressed, which again brings us back to that contrail thing.
I can already tell you there is plenty subject matter to be discussed and also to me this is work in progress. There are publications to be read, data to be analyzed and so on. And despite I do not like to raise questions I can not answer, on this instance I will take the risk. If I should need to revise my suspicion in the face of emerging facts, so be it. And I am saying this in the light of a wider context of circumstantial evidence making me believe it should not be happening.
Before we dive into the basic physics of contrails, let us consider the two conflicting positions named above, as both have their issues. In chapter 4 of AR6 draft there is very interesting statement:
Under present-day climate, cirrus clouds exerts(sic!) a net positive radiative forcing of about 5 W m-2
As I am broadly discussing here, the consensus understanding of cloud forcing is deeply flawed and underestimated. This is likely true for cirrus clouds as well. Yet let us take this estimate at face value. If true, it are not only those 5 W/m2 in forcing anyway, since in the nomenclature of “climate science” it would multiplied by feedbacks. I mean if a 2xCO2 forcing of 3.7W/m2 should warm the planet by 3K, then logically cirrus clouds @5W/m2 would warm it by about 4K, as a status quo.
The interesting part is the context with the above estimate on contrail contribution to climate change. If contrails, which are artificial cirrus clouds, provide a forcing of 0.06W/m2, then their share in total cirrus “forcing” is tiny. In fact it would only amount to about 1%, vs. 99% natural cirrus clouds.
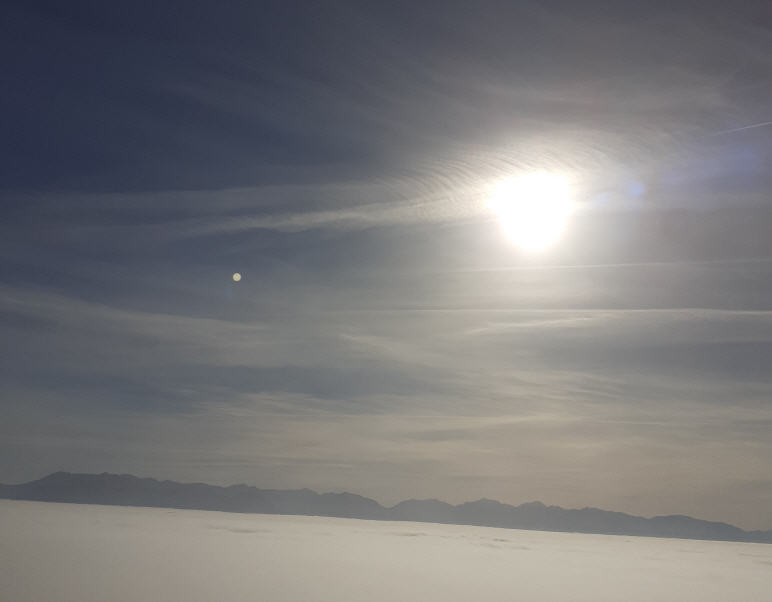
This is a little bit confusing, since although cirrus clouds can be a natural phenomenon that tends to look beautiful, most of the time they rather look like below. And it will not take a genius to figure out what caused them.
I may be biased, as Austria, in the heart of Europe, is certainly harboring some major flight corridors. But then again, looking up NASA data4, my home country should not be affected too specifically. So how could it be, that most of the cirrus clouds I ever see are contrails, while the IPCC tries to argue they are a rare occurrence by comparison? In fact, during the early 2020 lockdowns, I was amazed to see consistently clear skies for a prolonged time. That usual high altitude haze was gone. Even if there were clouds, they were conventional lower altitude, and the sky between them was clear and deep blue.
Please do look up and check for yourself, but I dare to say contrails being the rare exception, and natural cirrus clouds dominating by a 99%, is a ludicrous claim. Rather contrails seem the dominating cirrus cloud type these days. And if that is so, they might easily come in as the dominant driver of global warming.
The paper the named NASA article refers to, Minnis et al (2004)5, is not quite as straight forward as the quote above suggests. Essentially what they did was to look into the trends of cirrus (cloud) cover (CC), which happened to increase over the United States. Although that growth is pretty small, and could well be an artefact, the paper suggests very high climate sensitivity to even small changes in cirrus cloud cover.
Mind that climate sensitivity!
For a 1% change in absolute cirrus coverage with τ = 0.33, the GCM yielded surface temperature changes (DTs ) of 0.438 and 0.588C over the globe and Northern Hemisphere, respectively.
If I get the data right, CC was about 30% over the USA, with a growth of 1% per decade. Given a strong natural variability, the finding is hardly statistically significant. And indeed there are other regions where CC has been largely static, or was even declining, like in Europe or Asia. So even if contrails were to blame for the warming in the US, it would hardly translate into a global scale. With regard to global warming it all looks a bit like a nothingburger.
Note: since cirrus clouds tend to be optically thin or “transparent” and fade out into invisibility, a total CC of 30% is a dubious figure. It could easily be 10 percentage points up or down, depending on how sensitive the measurements are. Where exactly is the cuf-off between a just detectable cirrus trace and a non-detectable? Such a figure, and also the overall trend in CC, is to be taken with a lot of salt.
That is unless we start to read between the lines. The one big takeaway obviously is the enormous climate sensitivity to changes in CC, setting up the stage so to say. The other, more subtle question is, if contrails increase CC. And this is the gorilla in the room.
Let us take a step back and consider the question logically. We know contrails are artificial cirrus clouds and although fresh, linear contrails are easy to distinguish from natural cirrus, this soon changes if they prevail. Yet it are those lasting contrails, or the haze they convert into, which have the most profound impact. Identifying and quantifying this fraction of cirrus cover remains a challenge.
Automated detection and assessment of contrail coverage has been confined to contrails that are identifiable by their linear structure and small particle sizes. Because these identifying features are often lost as the contrails spread, the linear contrail coverage estimates represent the minimum amount of the sky that is covered by contrails6
Like in the picture above, aging contrails are likely more comprehensible for the human eye, than for any satellite observations. We can identify fresh and aging contrails. We see how parts of a contrail spread out vertically due to different wind speeds at different altitudes. And we would tend to assume the otherwise unidentifiable haze likely has the same origin as the parts we can identify as contrails. Optical impressions and satellite data are largely inconsistent, and while we know we can not trust the latter, we neither know if we can trust our eyes.
The need for experiments
Is the high altitude haze contrail related or not, that is the question. The only way we could find out for sure is by running a real life experiment. What would happen if we shut down all air traffic, or at least most of which? Given the huge cost and impact of climate policies, such a necessary diagnostic experiment is absolutely worth it. It is like paying a very modest insurance rate against a risk that could cost a hundred thousand times more, but is reasonably likely to occur. We simply need to know, before we possibly do the wrong thing.
Regrettably such rational considerations would hardly ever turn into concrete action. Shutting down air travel just for science seems off limit. Yet, it has been done for other, more immediate reasons. Covid19 related lock downs affected air travel around the globe, reducing operations by 2/3s or more. There are a lot of data out there yet to be analyzed. In 2010 there was the eruption of the easily spellable Eyjafjallajökull cancelling air traffic over Europe for about a week, and even before that we had 9/11 and the shut down following the event. In this instance we have one famous article with one pivotal claim.
Travis et al (2002)7 claimed that due to the shut down after 9/11 the daily temperature spread (DTR) increased significantly over the USA.
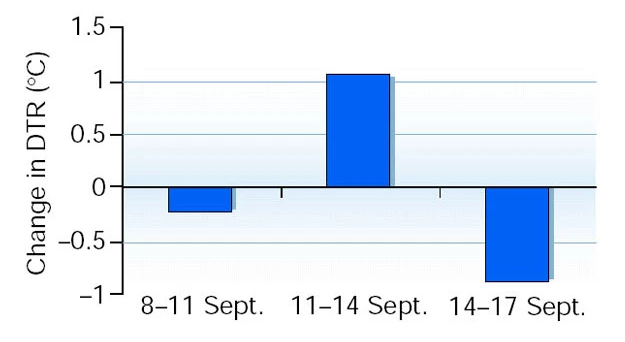
DTRs for 11–14 September 2001 measured at stations across the United States show an increase of about 1.1 °C over normal 1971–2000 values (Fig. 1). This is in contrast to the adjacent three-day periods, when DTR values were near or below the mean (Fig. 1). DTR departures for the grounding period are, on average, 1.8 °C greater than DTR departures for the two adjacent three-day periods.
Let me emphasize the paper says nothing about an overall change in average temperatures. Even over a larger area, like the USA and an extended period, like one month, temperatures can deviate by 2 or 3K due to natural variability, aka weather. It would be impossible to detect a much weaker signal against such loud background noise. Per se the massive expansion of DTR, as suggested by this paper, does not tell us if contrails are warming or cooling.
What it tells us however, is that contrails must contribute a huge share to CC. In fact it is pretty simple. If we consider the position of the IPCC, where contrails only added about 1% to CCC, removing this 1% while maintaining the other 99%, would not make much difference. Or alternatively, if that 1% was responsible for about 1.8K in DTR, then how much would the other 99% of natural cirrus do?
We know with clear skies DTR can be up to 20K, and average overcasts bring down DTR by about 80%, to only about 4K. With a 50% cloud cover DTR is roughly halved. I have published some data on this, but there is more to come. But these figures relate to optically thick, lower clouds. Optically thin cirrus clouds are just one species of clouds, and their potential impact on DTR should hardly exceed 3K.
If Travis2002 is not just describing an unrelated random event, but that increase in DTR is indeed due to the reduction in air traffic, then contrails massively contribute to CC, with something like a 50% share, or even more over the US. It is a totally incompatible position to what the IPCC claims. That is even if we consider air traffic to be way more intense over the USA than in the global average. Following the trend described in Minnis2004, by 2001 the contrail share might have amounted up to 10% over the US, which is still vastly insufficient to explain the named DTR effect, enough though to explain all the warming.
So we have open dissent, and again there seems to be very little awareness on the subject. And it is almost a binary question. Either the contribution of contrails to global warming is tiny, or huge and maybe even dominant. There is ambiguous information, pointing in one or the other direction. If only we could tell..
Covid19 related data
Wait a moment! Thanks to Covid19 we have a lot more data now, and new research has already been published. For instance Li, Groß (2021)8 (LG2021):
From the current analysis, it is striking to note that the cirrus ORs in April 2020 are smaller by a range of 17 %–30 % than the values derived in the reference years in spite of the cloud thicknesses on which a cirrus cloud was defined. The same findings, although with a smaller proportion, are also seen in the observations of March 2020 (see Table 2). Our results are consistent with the previous findings that air traffic might increase the occurrence of cirrus clouds
Here the data from Table 2, with the occurrence rate of March 2020 as a percentage of the six year reference period.
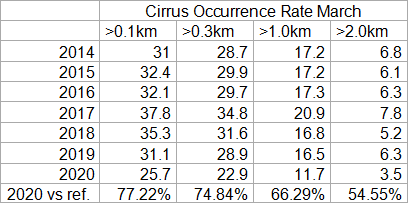
Although the paper claims CC reduction in March was less than in April of 2020, the data actually suggest the opposite. It is a reduction of 23%-34% in March. One should also explain that the authors assume thick cirrus clouds (>2.0km) were not contrail related, which is why they exempt it from the April range (17%-30%). To my knowledge this assumption is wrong, as contrails tend to spread rather vertically than horizontally9. Also it would make little sense if this sharp drop in thick cirrus clouds was unrelated to the declines in the other categories, and further unrelated to lockdowns.
Either way, the drop in air traffic in 2020 led to a massive decline in cirrus cloud cover. This stands in stark contradiction to the data Minnis2004 presents, despite a lot of time has passed since. Obviously this contrail contribution to CC was growing over time and it is unthinkable it had no impact by 1995 or 2000 respectively, the years marking the end of the time series used by Minnis2004. And of course we could discuss why these data failed to detect this growing contrail contribution, though it should not matter anyhow.
What does matter is connecting the dots. Minnis2004 suggests an average CC of about 20% over Europe (whatever that shall mean), while LG2021 points out some 25%, maybe even 30% contrail share in CC by 2019. Keep in mind there was never a complete shut down of air travel during 2020 lock downs. From that we can infer contrails should have increased CC by about 7 or 8 percentage points over Europe.
Then if climate sensitivity was indeed as high as Minnis2004 suggests, with about 0.5K warming for every percentage point increment of CC, it should have warmed Europe by 3.5 – 4K(!). This is far more warming than we can observe. But please keep in mind that there is convection, and a strong regional forcing would not be able to drive up temperatures just locally, like over Western Europe. Rather the heat would dissipate over thousands of kilometres. On the other side air traffic was not just growing over Europe, but world wide, though mainly in the northern hemisphere.
I need to bring this to an end, while obviously there remain a lot of things to be discussed. Also I know about a lot of twists and turns, complicating the subject, while this is only an introduction. For now let me just point out the most important question. Is there a possibility that contrails are the main driver of what is still anthropogenic global warming? The answer is definitely yes!
Comments (3)
PALLA Manfred
at 24.04.2022PALLA Manfred
at 17.07.2023JAMES SHUTIAK
at 07.02.2023