

The cloud mess part 2: Something spooky
If you go out and explore you might find the unexpected. If you are smart and explore, you might find what you expect, but no one else can imagine. Ok, what I did was to start climate research from the scratch and do the most reasonable, logical thing one could only imagine. I looked up weather records for statistical analysis. How are clouds and temperatures statistically correlated?
In meteorology cloud cover is usually described with oktas as a unit of measurement.12 Accordingly 0 oktas represent a completely clear sky, while 8 means overcast. In the (usual) case of doubt, the rule is to round up to the next higher okta, except for okta 8. This definition brings up a little practical problem with okta 0. When is the sky totally clear? Somewhere on the horizon there might be a trace of a cloud and already it is okta 1, not 0, if you follow the rule strictly. Such totally clear skies will be rare, except of course if it is dark and you will likely not see the very few clouds.
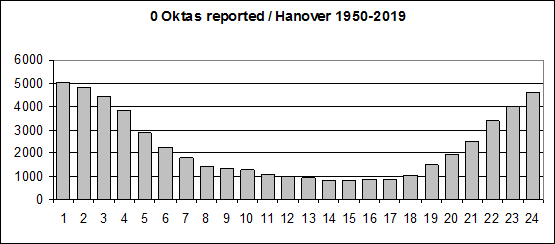
The chart gives the number of hourly 0 okta reports over 70 years for the german city of Hanover. As to be expected most of these totally clear skies are reported during the night, while they are very rare over day time. It does not require a genius to figure out why. Partially at least, this could also describe a natural phenomenon, and maybe totally clear skies are indeed a bit more abundant during the night? It should not matter anyhow for our purpose.
What does matter is the insight, that any 0 okta reports have to be taken with a lot of salt and that it will be up to the judgment of the individual meteorologist, whether he puts a basically clear sky into the 0 or 1 okta category. Why it matters should become understandable once we look at the average temperatures associated with oktas 0 to 8. Again, these are the results for Hanover for the period 1950-20193, with the month on the x- and the respective okta on the y-axis. Temperatures are in °C.
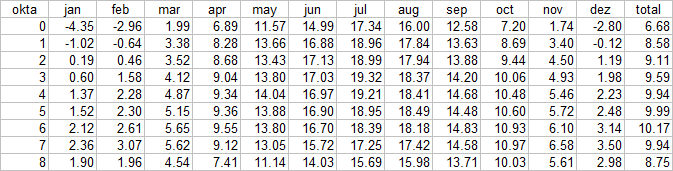
As these data show, we have by far the lowest temperatures with okta 0. Given the understanding that clouds are supposed to be cooling, this might come as a surprise. Of course it is not quite so simple. With most 0 oktas reported in the night, it is no surprise temperatures there will be comparably low. There is a strong day-time bias in these data and it affects primarily okta 0, but not only.
Averaging the monthly means should at least do away with seasonal biases and give us a first glimpse on the bigger picture. From left to right the curve moves upward, peaking with 6 oktas. With okta 7 & 8 however we see a sharp fall again and there is generally a very specific reason to it, which I integrated into the chart: rain (that is average mm of hourly rain).
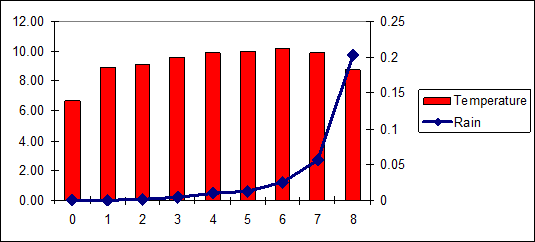
As we probably can all agree, rain falls from clouds. And most rain falls with the most intense cloudiness, as the above statistic shows. Again, nothing else was to be expected. The point about rain however is, that it reduces surface temperatures and it does so in two ways. Type1: it falls from higher altitudes where it is (usually) colder than at the surface and despite it may warm up during its fall, it will exert some instant chill when it hits the surface. Type 2: is well known to us humans, since we are one of the few species which can sweat. Water on any surface tends to vaporize and that provides a chilling effect as well.
It is mainly this "rain chill" effect which makes overcast skies look statistically colder. The rain itself, as much as it is "caused" by clouds, is not representing any radiative forcing by them. At this point we may assume the curve would be more linear and still ascending towards okta 8, if it were not for rain.
The described "rain chill" effect is depending, apart the amount of rain, on other factors like temperature and wetness. I think it is easy to understand how rain falling onto water will not increase its "wetness" and cause any increase in evaporation. Maritime climates will see very limited impact in this regard. With temperature there are a couple of factors to consider. Evaporation is, among others, a function of temperature. The warmer it is, the more evaporation, the stronger the chilling effect of rain. On the other side, if it is below freezing and rain turns into snow, we should not have evaporation at all. Also the delta between the temperatures of rain and surface should be small with low temperatures. For instance what arrives as rain, may have been snow in higher altitudes, falling a lot slower and having more time to take on higher temperatures and so on..
I do not want to make the subject of "rain chill" a science on its own, these are just a couple of considerations necessary to understand what we are looking at. Btw. the evidence based research on the cloud / temperature relation absolutely should be a partial science within climate research, and I have no clue why it has not been done before, to my knowledge at least.
Anyhow, if we look up the above table and compare oktas 6 to 8, we see there is a large drop off in temperatures during the warm season, and only a tiny one during winter. And that coincides precisely with what I just explained. "Rain chill" is, as the logic suggests, is indeed a function of temperature. We see a strong signal there with dry and warm climate, but it largely disappears with wet and cold climate. That should give us some theoretical foundations to understand and interpret these kind of data.
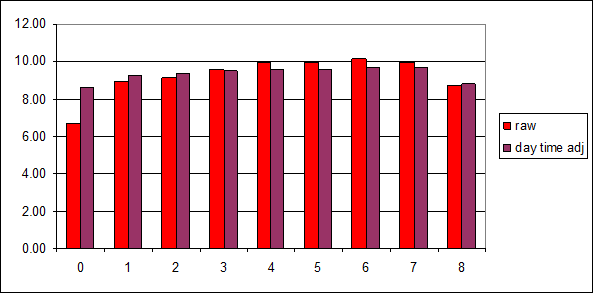
Yet there is another thing to do. What if we try to sort out the day time bias? The easiest why I can imagine doing so is by averaging temperatures not just for okta and month, but also by day hour. Only then these averages will be summed up. In this way a relative abundance of for instance 0 okta reports during night times will not distort the global average. Indeed the results change quite a lot, as again the example of Hanover shows.
Here is another one, Nuremberg 1951-2019:
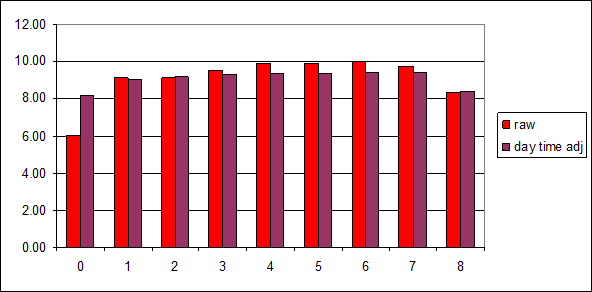
As to be expected 0 okta now looks a lot warmer than without day time adjustment, while intermediate cloudiness drops in temperature. The latter is certainly less an observation issue, but reflects a relative abundance of these sky conditions especially during the warm season. Overall the curve has flattened substantially.
Anyway, the basic positive correlation between clouds and surface temperatures is still there, which is a very serious issue and brings up a lot of questions. Is this just a random result, maybe true for some selected German locations? No, it is not. Actually there is a lot more data and a lot more views on them to be discussed, I just can not put it up all at once. All the little issues discussed here are universally valid and we will encounter them with other data sets.
If clouds are cooling, how can it be we see the opposite correlation in the empiric data? Could a negative NCRE (net cloud radiative effect) be masked by a correlated abundance of vapor? Again, this is a profound question yet to be discussed, but (spoiler alert) I am afraid the answer is no. What we have is an open dissent between the empiric data suggesting a positive NCRE and the satellite data products (ERBE, CERES..) which suggest the opposite. This puts a question mark on our most profound understanding of the GHE. I know why that is and the answer is appalling.
Comments (0)
No comments found!