

The cloud mess part 3: data, data, data..
Alright, this is a little bit of a time travel back to the roots, so to say. But also it is about how science should work as opposed to how it (not) works in today’s academic life, where it is all about quoting correctly. I mean yeah, quoting should be done correctly, at least with regard to the intent. The form however will obviously be less important. And most of all, quoting is not science, but rather the opposite. Science is about exploration, not the conservation of knowledge, and this conflict is as old as mankind itself. I digress..
A couple of years ago I had an enlightening experience. It was a hot summer day in my home town, temperatures scratched the 35°C mark in the afternoon. There is not much heat island effect, since the town is a) not large enough and b) is bit stretched out with a lot of green in between. Thus in the late night temperatures would safely fall below 20°C, somewhere around 15-17°C typically, that is during peak summer.
That night however, it was on a weekend, was different. Just after sunset a thick cloud cover moved up. There was no thunderstorm, no rain, just a solid cloud cover. I went out and when I returned home at around 4am, just before sunrise, temperatures were still around 25°C, making it a perfect tropical night, something very rare in this place. Obviously the cloud cover prevented the usual night time cooling cycle.
The impressive part here was in the effectiveness of clouds retaining heat. I mean it is all understood that clouds will keep winter nights a little bit warmer, but you probably would not expect that much of an impact on summer nights. Then again, this could have been more like a random weather event, maybe related to foehn winds, and not so much to the cloud cover itself. I just had to find out.
What I started doing was to search for weather records including cloud cover and then try some statistical analysis. I should note, there seem to be no papers investigating the relationship of clouds and night time cooling (NTC). What I found were “QCLCD ASCII Files” provided by the NOAA1. Regrettably they pulled it off their site soon after I started downloading chunks of it, and so I ended up having just two years worth of data, with a third year lost due to a broken zip file. Yet, the idea was never about reconstructing long time series or something like that, so it would not matter too much.
The cloud data themselves are reported in the METAR2 format , which is a convention used in the context of aviation and is limited in a number of ways. First of all cloud cover only comes in five different shapes (CLR, FEW, SCT, BKN & OVC), see table below. Then there is a maximum reporting altitude of only 12.000ft (though there may be exceptions), which obviously is true for the bottom side of a cloud layer. Also there are typically combinations of cloud intensities, with intensities increasing with altitude. For the sake of my analysis I stick to the maximum intensity.

In the first approach I uploaded the two years of data for a specific station into Excel and started figuring out what I could do with it. My idea was to calculate an average degree of cloudiness for single nights, based on the different data points within the night. It seemed logical to convert the METAR cloud intensity back into the numerical average Okta value they represent, so that I would get a number between 0 and 8 for every single night. Finally I would simply order all these nights by that number, group them and check how on average temperatures evolved with all these groups. The question was, would this procedure yield reasonable results?
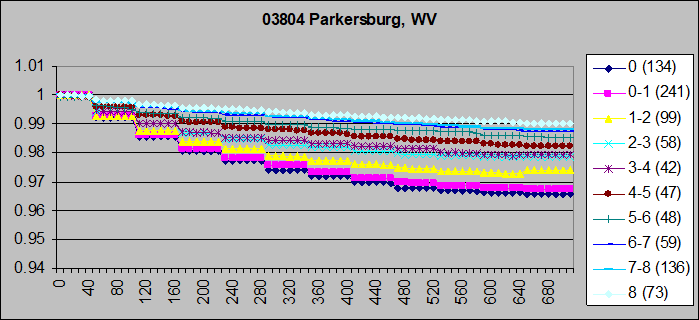
Seems so! I just wanted to show the original output, so I will have to explain what we see here. The x-scale gives the minutes into the night after dusk. The y-scale is temperature in Kelvin, and since I did not care about the absolute temperature, it shows how it evolved relative to the temperature at dusk. A just over 3% drop may seem very little, but keep in mind this might mean going from 290 to 280K, for instance. Btw. Parkersburg, WV was just a first random pick. The right box gives the respective group and the number of samples (or nights) it includes. Note: 0 Okta means a sub-sample of 0-1, and 8 a sub-sample of 7-8.
What this first glimpse behind the curtain suggested was that clouds indeed are the decisive control knob of NTC. Compared to clear conditions, overcast nights show about 80% less cooling on average. Also, despite all the imperfections and limited data size, there is a very strict relation between cloudiness and cooling rates.
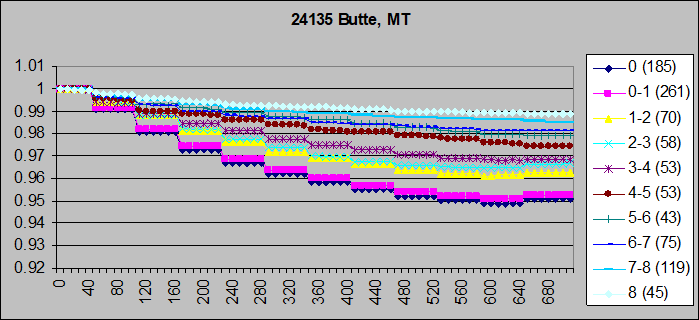
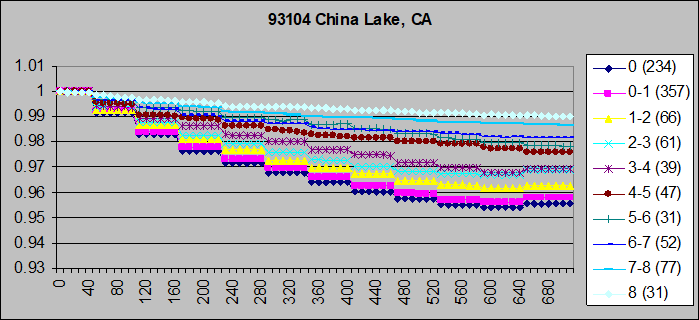
Once the basic procedure was implemented and a number of VBA scripts written, it was easy to apply it on different data sets from different locations. The results were highly consistent throughout, so there is actually not much to tell. Arid places would obviously have a large share of clear nights, maritime climates would show a small temperature spreads all over, as to be expected. Just two more examples..
This first glimpse behind the curtain brought up a very tricky question. I mean night time cooling rates are kind of a real life representation of what the GHE is. Without energy added, it is all about how the atmosphere allows the surface to cool. And the data clearly show what a massive role clouds play in this. With NTC rates showing a relation of 1:5 between OVC and CLR nights, it was hard to imagine clouds might overall be just a minor GH-factor. At that point I had no different information than what the “consensus” suggests, which is some 30W/m2 of average CRE and a 120W/m2 of GHGE.
Regrettably it was very hard to put these results into perspective. We do not have any real world situation where there are no GHGs. The moon can not serve as a benchmark, since it does not hold a modulating atmosphere, day-night cycles are far too long and the dusty regolith surface has very low thermal conductivity. Mountain tops in the Himalayas have very little GHGs above them, but they have not much of a micro-climate, as the relation of surface to the engulfing windy air is far too small. That is next to lacking data anyhow.
However, at least we have deserts with a low abundance of vapor, and that is where the question aroused. With clear skies AND reduced GHGs you would expect to see even larger temperature spreads and accordingly strong NTC. Also this is what NASA and many others erroneously claim, as I have pointed out here. However, that is not the case. There is a spread of up 20K and not more, not even in the desert. So, with no or only little “headroom” left, does vapor even matter? It was an intriguing thought, also one that contradicted “common sense”, given all I had learned so far. Obviously it did not make much sense to me, but the hint was there and sooner or later I would go after it.
After a while something occurred to me what should have been obvious from the start. Those METAR records not just give information on the cloud condition, but also on relative humidity. It should be the easiest thing to apply the same procedure on relative humidity instead of clouds. Said, done, jaw dropped..
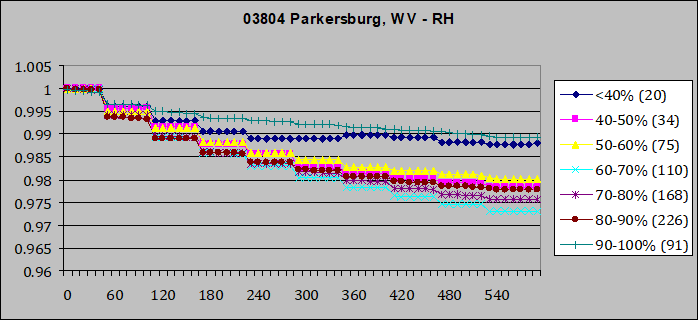
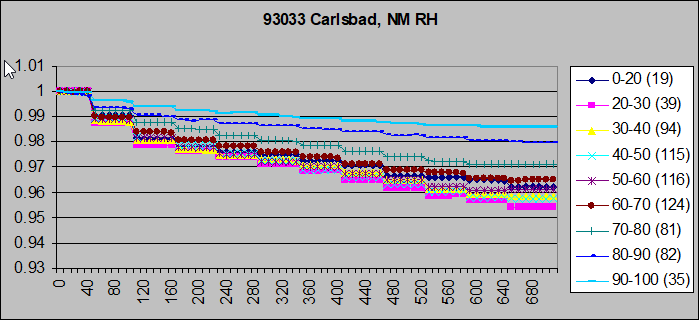
Again I started with Parkersburg, because why not. We see the least NTC with the highest humidity levels, which is exactly what you would expect. Beyond that nothing made sense. Second least cooling is with the driest(!) conditions. All other humidity levels are very close by and yet in the “wrong” order. Of course you would expect NTC and humidity to be negatively correlated, and closely so if vapor was the all important GHG. However, the empiric evidence says no! It was amazingly fascinating when I saw it the first time.
By now I guess I have a better understanding of what these data show. Very high humidity levels in the 90-100% interval are typical for rainy nights. As rain falls from clouds, there will be a strong correlation with overcast skies, and we have already seen the dominant effect of clouds on NTC. With low humidity it is a bit harder to explain. First of all the sample size is pretty small, so yes this could be pure random. But since it is so small, I simply looked up what actually happened in these few occasions, and what I found is, that at least within this climate, the causation was apparently reversed. It looks like temperatures stayed largely flat for external factors and thus relative humidity, which goes down and up in a daily cycle, remained low.
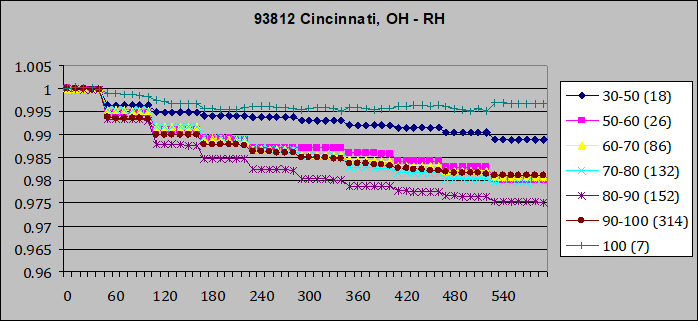
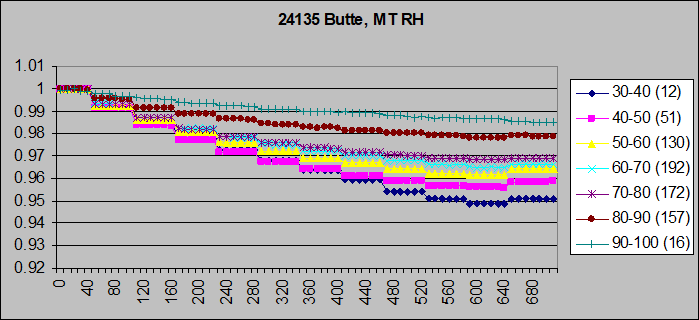
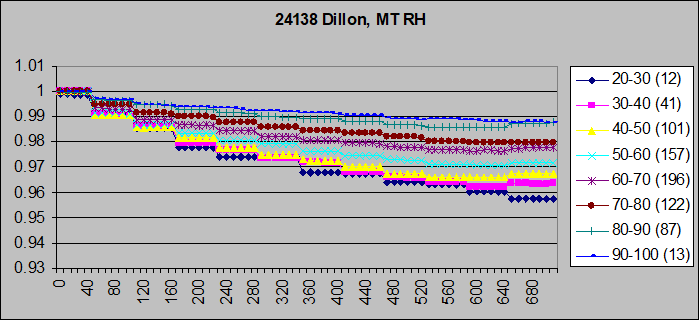
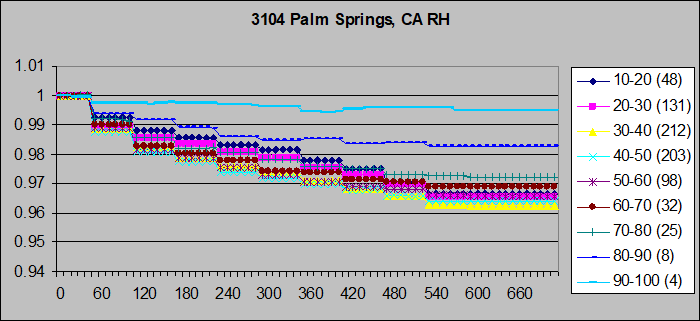
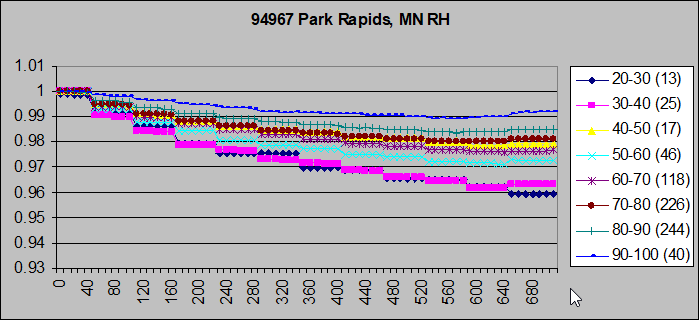
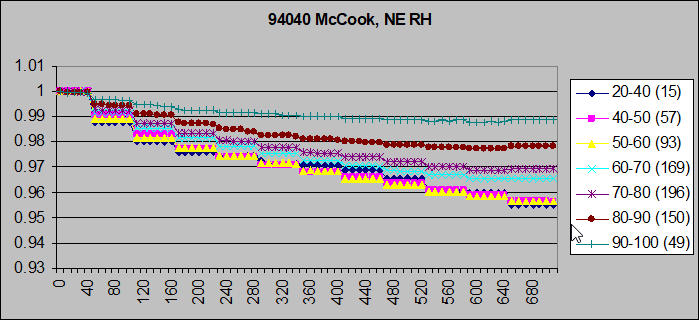
These things are to be considered back and forth when interpreting the data. High humidity levels show low NTC mainly because associated clouds. Otherwise there only seems to be a very lose correlation between humidity and NTC, if there is any at all. Some northern US48 locations, like McCook, Park Rapids, Butte & Dillon at least suggest some “proper” correlation, yet there are seasonal biases largely responsible for it. Relative humidity is higher during the cold season while temperature spreads decline due to the weakening sun. This bias will necessarily grow with latitude.
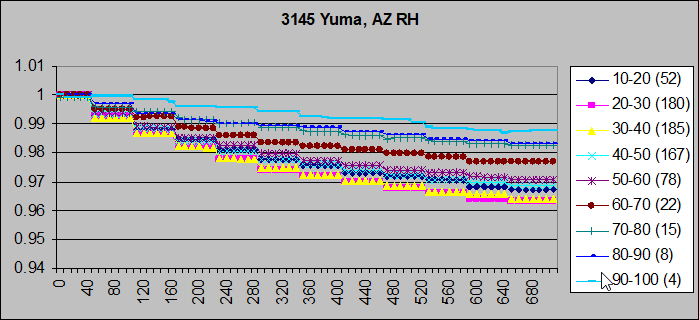
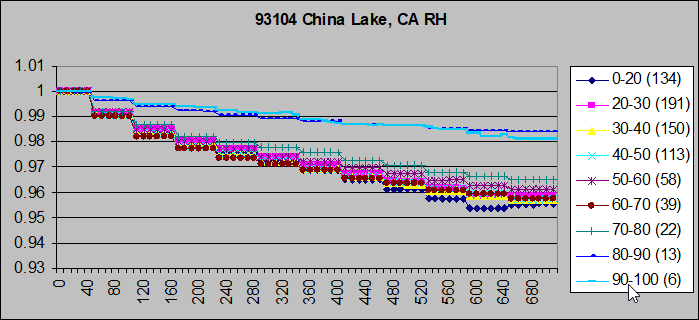
On the other side southern, arid locations where this seasonal bias is small, reveal the shocking truth. Again, rain & cloud related high humidity levels are associated with low NTC. Underneath these levels there seems to be no correlation at all. 70% RH, or only 10%, cooling rates are essentially the same. It is, or rather was an outcome totally inconsistent with the consensus understanding of the GHE and the role of vapor in it.
As subtle, complicated, imperfect, confusing and inconclusive this analysis worked out, it provided me plenty of bread crumps to follow. It is like reading a book from the end and it almost feels like cheating. You know how things turn out, but have no clue how it came to this. But from there on I could ask the right questions!
Comments (0)
No comments found!