
Deception with emission spectra part 2
While the data itself may be sound, the samples published are usually hand-picked to support a certain, deceiving narrative. Then with the sub text, the explanations hereto, the gloves are off and there are no more limits to deception and lies. Let us discuss another example, this time with a desert climate.
Desert climate is an interesting subject on its own, since there are lots of urban myths around it. Also it brings up some interesting questions in terms of climate science. I mean how comes we have the highest average temperatures right with the super dry Sahara? If vapor is the most important GHG, which is relatively rare in the desert, then something does not add up here. We will find out why that is, just not yet.1

Let us first deal with the urban myth that deserts would turn "awfully" cold during the night. You will not just find plenty of sources pointing out to the "fact", but also explanations to why that is.
A lot of water vapor in the air makes the air act as a water blanket, keeping in the heat or the cold better than air with low water vapor. Because deserts have such little water vapor in the air, it makes it harder to trap heat or cold in a desert.2
The temperature in the desert can change drastically from day to night because the air is so dry that heat escapes rapidly at night. The daytime temperature averages 38°C while in some deserts it can get down to -4°C at night.3
Interesting! So it is the lack of vapor which turns desert nights so cold. But then, why are deserts so hot all over? Should the dry air not equally fail to hold back heat during the day time? The reasoning seems a bit odd, to say at least. It will not matter anyhow, since the phenomenon thus explained does not exist in the real world. And no, I am not shitting you! As anyone can easily verify desert climates show no extraordinary day-night temperature spread at all.4
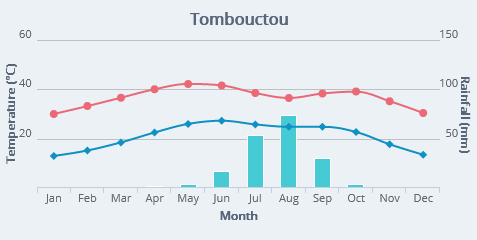
Even with an extreme desert climate like that of Timbuktu the temperature spread will only scratch the 20°C mark, not more. With clear skies, which are very abundant in the desert though, you see the same spread with any continental climate, be it in Europe or the USA. Then of course one might argue these are averages and with clouds the spread will be smaller, but larger with clear skies. The problem is, from November to April you not just have no rain, but also almost no clouds either. So these averages do represent the daily temperature spread with clear skies. And of course we could look up a lot more sources5, with different desert locations, but the story is always the same. With clear skies the spread can be up to 20°C, and that is it.
There is actually just one exception to this rule, that is high plains like Tibet or the Andean plateau where the spread can grow substantially over 20°C. The reason for it however is not a lack of GHGs, but simply the thin air which moderates surface temperatures to a lesser extend.
With that myth busted, we are still left with very dry air in the desert and the fact that it obviously does not cause any extreme, or at least unusual temperature spreads at all. So the above quote from NASA is not just wrong in every regard, it is also insanely stupid.
"in some deserts it can get down to -4°C at night"
Not -2°C, not -3°C, no, it can get down to -4°C. And where exactly? In "some deserts". Brilliant! Life imitating comedy.
Still there is a grain of truth to the myth, but it is very different from the quoted narrative. While the meteorological temperatures, taken 2 meters above the soil show no unusual extremes, the surface itself, the sand is a bit specific. In general surface temperatures are more "extreme" than air temperatures, thus the rule to measure 2m above the soil. And this is especially true for (dry) sand, which has very low thermal conductivity. Accordingly sand can turn very hot in direct sun light (ever burned your feet on the beach?), but also surprisingly cold during the night. If you touch it in the night, it may feel as if just taken out of a fridge. All that is to be considered if we look at the following emission chart.
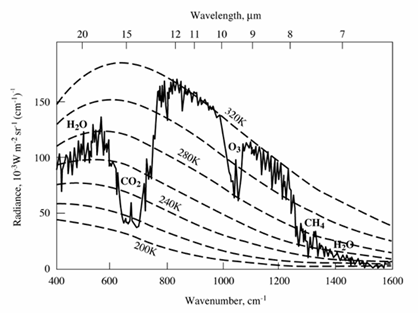
Terrestrial radiation spectrum measured from a satellite over northern Africa (Niger valley) at noon. Blackbody curves for different temperatures are included for comparison.6
Thus, our first approach might be to interpret the figure as an infrared absorption spectrum with the surface of the Earth below the satellite as an infrared light source whose emission spectrum is that of a black body at about 320 K (117 °F—northern Africa at midday). Deviations from the 320 K curve, the dips where less radiation reaches the detector, would then be ascribed to absorption of infrared radiation by gases in the atmosphere.7
The impact of GHGs looks very impressive here. The suggestion is the surface would emit like a blackbody at some 320K, or even 323K. Again there is the notion of the surface being a perfect emitter. Now even in the Niger valley, which is one of the hottest places on Earth, temperatures of 50°C are rare. The actual temperature record for Niger is 49.5°C for instance. So are these emissions even possible?
Of course, since it is not the air 2 meters above the soil emitting, but the surface itself, the sand that turns so much hotter than the air in direct sun light. And that is the reality behind the chart. It is not a blackbody at some 50°C emitting here, but a grey body at a much higher temperature. Sand is not a great emitter in general, but it is especially bad in the 8-9.5µm range, which is why the curve is well below the 320K line on the right half of the atmospheric window.
But now imagine what happens in the night. Air temperatures may fall by up to 20°C, but the sand may easily turn by a 40°C, or more. Also air temperatures higher up tend to be pretty stable within the day-night cycle, so that emissions from GHGs will not change a lot. This chart would look very different if it was not taken at noon, but in the late night. Except for the CO2 range, GHGs would not seem to make much of a difference. A big part of the GHE suggested by the chart, has nothing to do with the GHE, but is only due to the strong temperature variation of the surface as opposed to that of the atmosphere.
These data can be so deceptive if not put into the right context.
Comments (3)
Peter
at 13.11.2025Peter
at 03.12.2025GHD
at 03.12.2025https://greenhousedefect.com/basic-greenhouse-defects/this-planet-deserves-a-better-class-of-climate-denier