

CO2 Sinks failing?
As with a previous article I already pointed out there is something going on. Either, as you could read from the official data, CO2 sinks have been weakening over the last ~15years, or there is massive underreporting of our emissions. I have looked a little closer at some of the data since then, and there are some interesting finds.
First of all the nonsense paper Liu et al 20151, published in Nature, claimed a 0.499 effective carbon share in Chinese coal was 40% less than a 0.713 base assumption by the IPCC (defying mathematics!), so that it had overreported its emissions and thus, in all fairness, should emit more in the future. At the same time the paper had the audacity to call for a carbon budget reduction for all others..
A systematic reduction of fossil fuel and cement emissions of 0.35 GtC translates into a 15% smaller land sink when this term is calculated as a residual between anthropogenic carbon emissions, atmosphere carbon growth and the ocean carbon sink, and is two times the estimated carbon sink in China’s forests (0.18 GtC y21). Thus it implies a considerable revision of the global carbon budget
That too is a common pattern. China, be it in scientific papers or on conferences, will push for net zero - in the west. Itself is tied up being a “developing country” and regrettably can not take part in saving the planet, for now. All this is absurdly political and you can barely trust any statistics on the subject. And because of the nature of the issue, it all boils down to the accuracy of our global emission figures.
I have to admit I was bit influenced by my AI conversation in the China article. The default value of some 2,5t CO2 per ton of coal is pretty consistent with the IPCC estimate of some 71% effective carbon content. Overall however, the estimates appear to be substantially lower. China obviously wants us to believe its coal was just emitted 1.6tCO2/t coal despite a tiny share of lignite, so there is a wide gap between those different estimates, or assumptions.
EIA data on coal
I only just quoted the numbers from ourworldindata (OWiD)2, while of course there are other sources. For instance the EIA3 (U.S. Energy Information Agency, not to be confused with the IEA) has Chinese coal consumption at 5.24 giga short tons in 2023, that is a metric 4.75Gt, consistent with other sources. However, CO2 emissions there were 9,565Gt. If that is so, it would still mean a factor 2.015. Equally, considering other fossil CO2 sources, that will put Chinese emissions safely above 13Gt altogether, in 2023.
On a global scale it will equally be a bit more. Just from fossil fuel consumption the EIA states 37.1Gt CO2 in the year 2023, close to a 37.3Gt CO2 as named by the IEA (International Energy Agency)4. On top of that there would be other factors, like cement almost accounting for 2Gt, flaring ~0.4Gt, and land use ~3.5Gt. Adding it all up gets us to about 43Gt already. Of course I am not saying the EIA is right and ourworldindata was wrong. I understand they all lack complete data and have to make some assumptions there and there.
The interesting part about the EIA data is that they also provide statistics on the species of coal (as below), next to coal related emission figures. In this way it becomes feasible to make plausibility checks. For instance, in the year 1980 there would have been a total of 3767Mt of coal (metric!) resulting in 7494Mt of coal related CO2 emissions. The conversion factor would then be 1.99. Of course the share of lignite back then was ~25%, sharply reducing the average conversion factor. If you assume those 25% of lignite only held like 40% the carbon of other coal, then the conversion factor for “regular coal” would be a healthy and reasonable 2.39, not much lower than the 2.5 the AI assumes.

With this I can make assumptions on the carbon share within the different species, as listed below
0.9 Anthracite
0.8 Metallurgic Coal
0.65 Bituminous Coal
0.4 Sub-bituminous Coal
0.3 Lignite
These are rough, central estimates for the respective species. By no means these would be THE correct values, but just educated guesses. Their merit is in allowing us a rough reproduction of the EIA emission figures, and detect any deviations, not to be explained by the composition of the respective species.

First let us look at the coal / CO2 conversion factor in total. It was around 2 for most of the time. The slight decline towards 2002 kind of makes sense, assuming coal consumption was relatively flat, only growing gradually, with most of the growth in low carbon sub-bituminous coal. From there on, the strong growth of bituminous coal, mostly due to China, raised the conversion factor again.
Around 2015 the conflicting information coming out of China apparently caused some statistical woes. First there was the revelation of higher than previously known coal consumption, then the Liu et al paper claiming less carbon content in Chinese coal, followed thereafter by reportedly declining consumption in the next years, which may never have occurred for real. Also consider coal usage may just be reported as caloric energy, not giving any mass figures at all. As a side effect, let us call it statistical resilience, CO2 intensity peaked with the EIA estimate.
Things will a look different when using the species based estimate (blue) and compare it to the EIA emission figures (red), plus the ourworldindata figures (green). Up to 1990 it is pretty good match, with only 4% deviation, meaning the EIA figures were 4% lower. Thereafter however the gap widened. By 2023 emissions would have been 19Gt of CO2 species based estimate, but only 16.65Gt with the EIA, and only 15.4Gt with the ourworldindata estimate respectively.

Putting the EIA figures as a ratio to the species estimate reveals how complicated things got over the last years. Despite China “discovering” lower carbon content in its coal, the EIA carbon intensity estimate actually bounced back up around 2015. But then since 2020 it just dropped off inexplicably.

Yes, there has been a substantial increase in sub-bituminous coal in the statistics, but that should be well accounted for within the species based estimate. Also CCS (carbon capture storage) so far has no significant impact on the emissions. It appears there is substantial uncertainty on the CO2 intensity of coal usage, easily translating into a couple of Gt of CO2 emissions, which could be higher in reality. That is next to the uncertainty over the quantity and quality of coal usage.
Land Use
With land use we have a similar problem. For 2022 ourworldindata, the source I relied on in the previous article, names a 3.54Gt coal related CO2. With the “global carbon project”5 that figure is 1.2GtC instead, translating into ~4.4Gt CO2. Just using this figure, assuming it would stay flat through 2023, the 37.3Gt IEA figure for fossil fuel usage plus a 2Gt for cement plus flaring, we would almost have 44Gt in total.
But wait, there is more. In its 2020 publication the global carbon project named a 1.8GtC of land use emissions for the year 2018 (yellow line), translating into 6.6Gt of CO2. That figure was then revised downward, and back upward gain. It is all just models, with different assumptions, the uncertainty is huge, I understand.

The problem is, if we take a step back, had it not been for the questionable downward revisions of the various kinds of CO2 emissions, mostly concerning coal and land use, total anthropogenic CO2 emissions would not have stalled at all over the last 14 years. They would easily be above 45Gt of CO2 today anyway. The perceived weakening of CO2 sinks is directly related to it.
Just as I am writing this article, I stumbled over another CCP publication in Nature titled “China’s carbon sinks from land-use change underestimated”6 – of course I should add (!), and of course published in “Nature”.

In 1987, just 20 miles down the road from me, there was a climate convention in Villach, Austria7. It directly lead to the constitution of the IPCC a year later, and the First Assessment Report (FAR) was published in 1991. Zhu at al want to make us believe that the impact of that FAR was so immediate, that China started reforesting efforts just in the same year, with much of the effect already taking on in that year.

Just comparing it with the current ourworldindata chart reveals how funny it is. Note: Zhu uses GtC while OWiD denominates in GtCO2, with the conversion factor being 3.67. There in the 1990s Chinese land use would have emitted about 800Mt CO2 a year, or ~220MtC. Only from 2014 onward reforestation would have resulted in consistent negative emissions. So was the knowledge and assessment so far. Zhu et al, Chinese scientists working totally independent of the interests of the CCP, as anyone in China, turn this upside down and rewrite history.
How could it happen that land use was absorbing, rather than emitting CO2, for over two decades, with no one noticing? Not just is it not credible per se, but also it puts a huge question mark on any of these figures. In the real world uncertainty can not know only one direction, in the sense of “oh, we overestimated Chinese emissions again, and again, and again..”. It is hard to fathom how stupid all this is.
Methane Oxidation
With the hydroxylation of methane we have yet another source of anthropogenic CO2 barely ever considered, at least not in terms of CO2 emissions and their relation to CO2 sinks. As discussed before methane has a short half-life only about 6 years, after which it gets mainly converted into CO2. As in the graph below (IPCC AR6), over 500Mt of CH4 thus get converted from one GHG to another one.
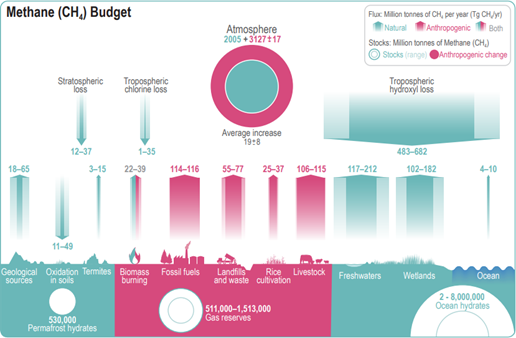
Because of the mass relation between CO2 and CH4 (44 to 16), a ton of methane would equate to 2.75tons of CO2. Assuming 500Mt of methane turn into CO2 per year, we would be talking about 1.4Gt of CO2. It is likely going to be a more, since atmospheric CH4 levels have increased since AR6, the average estimate in the graph is 582Mt and ~90% convert into CO2.
Of course not all of that is anthropogenic. We have 1.9ppm of atmospheric CH4 concentration now and it should have been ~0.7ppm pre-industrial. Methane was a source of atmospheric CO2 before mankind. Only allowing for the anthropogenic share, methane should add about 0.9Gt CO2 per year. It is not much, but not negligible either, especially with regard to the assessment of CO2 sinks.
Adding up uncertainty
So where does it get us, and what is the uncertainty over our current CO2 emissions? I have made a little table with the data for 2023 – hopefully helping to discuss the issues.
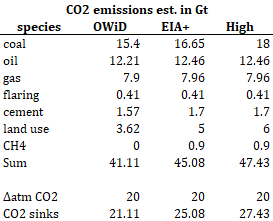
Species by species the ourworldindata data (sorry!) amount to 41.11Gt of CO2. It is a bit odd, because they also have the option “fossil fuel + land use” amounting to 41.42Gt. If you add up all the single species you are missing 0.3Gt, for whatsoever reason. On top of that, cement should not be considered a fossil fuel?! But hey, whatever..
The EIA data on the other side have significantly higher emissions from coal combustion, while oil and gas only provide a tiny markup. The EIA does not give figures for other sources. The OWiD data show some strange declines for cement and land use. For instance cement went down from 1.7 in 2021 to 1.57 in 2023. Given 2021 was an all covid year, it looks highly implausible construction was lower in 2023 than 2021. Also this decline is a 100% due to the figures China reported, casting a lot of doubt.
Up to 2015 QWiD has land use in the range of 5 to 6Gt per year, a figure consistent for over 6 decades! Only then it dropped off by about 2Gt per year. Incidentally it is about the same time that China started actively downplaying its emissions and global emissions started to flatten out. Also please consider, as noted above, the global carbon project (GCP) had 2018 land use emissions originally estimated to be 6.6Gt vs. 3.8Gt now with OWiD. For 2023 GCP estimates land use emissions of 1.2GtC anyway, translating into 4.4Gt of CO2. The uncertainty is obviously huge and a more conservative approach just demands us considering there might be substantially higher emissions, like 5 to 6 Gt. Then finally taking CH4 into account, again something that seems to be completely ignored otherwise, we end up with 45.1Gt CO2 emissions in 2023.
While all this is still a pretty conservative estimate, we can not ignore the sharp drop of CO2 emissions per ton of coal in the EIA data. It is inconsistent and inexplicable. If it did not happen, coal related CO2 emissions would be about 18Gt. Also we may consider land use emissions in the somewhat higher range of the long term average. Doing so will yield 47.4Gt of total CO2 emissions in 2023, a combined 7Gt more than OWiD and most other sources claim.
I am not saying that is the truth, because I do not know it either. All I can do is to make reasonable considerations and discuss them. Yet in this instance, I can not help but to get the impression of our emissions being actively downplayed. It looks like everything has been tuned down a bit, or even omitted. There is plenty of room to argue emissions were actually higher, while there is zero margin for claiming the opposite.
Over the last years, since 2020, atmospheric CO2 concentration increased by ~20Gt a year on average. There is huge variability mostly caused by sea surface temperature, and yes that is an issue on its own right. But just taking it as a base line, I wanted show how immanent the estimate on our CO2 emissions translates into that of CO2 sinks. They are almost certainly getting underreported, possibly in a range of 4-7Gt.
Bottom Line
So what is the bottom line? Obviously I will suggest we are understating our emissions and equally CO2 sinks. There might be a couple of sinister motives for doing so. For one China is apparently downplaying its emissions so not to ridicule all net zero efforts elsewhere. Given it is by far the largest emitter, that alone will impact the global figures substantially.
Then if there is no decline, or at least stagnation of global emissions, that would necessarily put all efforts in question. Making the case for ruining the west without any tangible result, in the context of the climate agenda, would make it very difficult to pursue such policies. If the only result is the transfer of production and emissions to China and other countries, with a net gain in emissions on the way, there is just no case to make. It would make it an inconvenient truth, best to be concealed.
Eventually “failing CO2 sinks” make for a wonderful alarming headline, putting up pressure to enforce even tougher measures. Plus there is yet another aspect. The failing CO2 sinks have been predicted, as one of the justifications of net zero. If they were not to fail, just lowering emissions might be a viable option, assuming CO2 was the control knob of climate. So yes, there are a lot of “good” reasons to downplay our emissions. Cause after all, it is about more for me and less for thee.
Comments (0)
No comments found!