

The (true) CO2 Emissions of China
In the Paris Agreement China promised to reduce its CO2 emissions, from 2030 onward, relative to 2030. From there on the emissions should shrink to net zero by the year 2060. The interesting feature about this agreement is that up to 2030 China can emit as much as it wants to. Not just that, it even puts itself in a better position by maximizing its emissions, because it will have a larger CO2 budget to work off later. There are further commitments, like planting trees, decreasing carbon intensity of the GDP, or certain shares of “renewables” in energy consumption. But none of these are much of a restriction.
As you will know China today is by far the biggest CO2 emitter in the world, responsible for about 30% of global emissions. At least so goes the official version. Depending on the source, these are about 12Gt of CO2 p.a., up from 3.7Gt in the year 2000. That is over 25 years of climate alarmism and fighting CO2 emissions, and no one really seems to care.
Analysis: Clean energy just put China’s CO2 emissions into reverse for first time1
If you google “china co2” you will almost only get good news, regardless if you do it in German or English. It is not so bad, Chinese emissions are decreasing, China is leading the world in clean energy, and so on. Climate activist sources put up stuff like "Endlich das China-Argument entkräften" – “finally rebutting the China-argument”2. The bottom line is, do not worry about China, nothing to see there, just move on to net zero! You know, only “climate deniers” would disparage the message.
I could not help but to question Grok on Chinese emissions, and that is what I got.
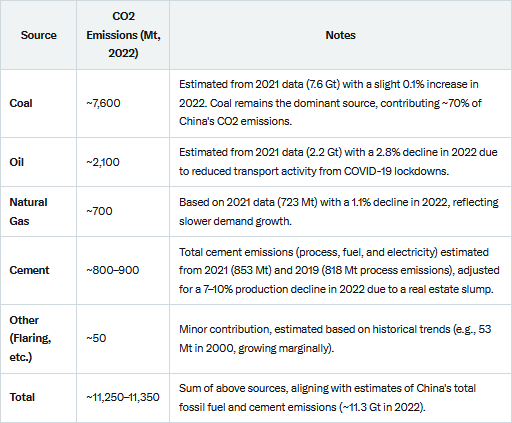
A total of 11.3Gt in 2022. We do not have 2022 anymore and of course that year was affected by covid19, lowering the emissions. So it looks like an odd choice to make. But as with the google search, there seems to be a pattern. You always get the “sunnier” side of the story, nothing too disturbing hopefully.
Also you have past “news” on the subject that aged like fine milk, like from the “United Nations University in 2015”: “China’s Coal Use May Have Peaked Years Ahead of Schedule”3. Further: “China’s coal use (dark orange) has dropped sharply since 2013, according to analysis of government data by Greenpeace/Energydesk China”. If Greenpeace, communist China and the UN team up, it can’t lie, right? Well, despite a negligible decline after 2013, Chinese coal knew only one way since then: up!
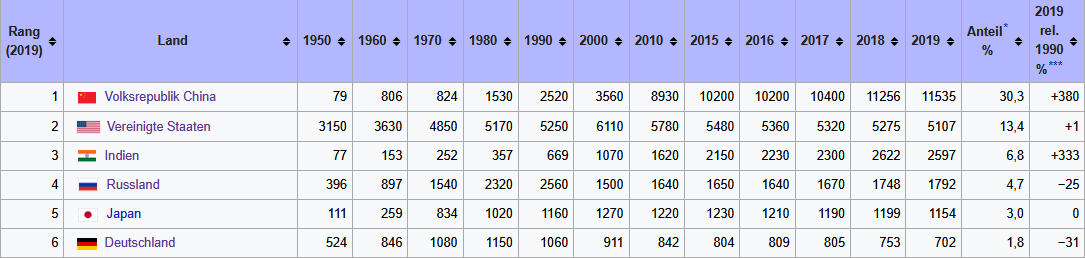
Another very common talking point, at least in Germany, is to claim Chinese emissions are lower per capita than those in Germany. While this has not been true for a while, the message is resonating pretty well. Why would you not allow another people to emit as much CO2 as yourself? Do you think you are something better, some kind of “Ubermensch”? Nazi! Again this cancels every discussion, even if there is a scandal over Germans paying for CO2 certificates with that money sent over to China for fake CO2 reduction projects4. Another way of mitigating the problem is by simply not updating stats. On German Wikipedia the latest data are from 2019.
The darker reality
In an environment where evidently the perception is getting manipulated, one might assume there is more hidden from the public. And something just will not add up here. China has not been backing down from coal in the recent years, instead it is relentlessly investing into new coal fired power stations. In 2024 alone China launched another 94.5GW of coal power capacity, about 1.5times the electricity need of whole Germany.5
Today China consumes more coal than the rest of the world combined, about 5Gt (production: ~4.8Gt plus ~0.3Gt in imports)6 out of a global 9Gt. This is pretty sick shit! But the tricky question now is on how much CO2 this would mean. You would expect a simple formula, or a conversion factor respectively, to translate every ton of coal into the according amount of CO2. The problem is just, coal is not coal.
Theoretically burning a 100% pure carbon coal should result in 44/12 = 3.67times the mass in CO2. That is because carbon has a molar mass of 12, oxygen 16, and so the final CO2 molecule “weights” 44. But that is only true for pure carbon in the process of perfect combustion. In reality however coal only has a high percentage of carbon, which varies substantially (something like 50% to 90%, with lignite just ~30%) and defines the quality of the coal. One might expect lower carbon content would be eco-friendly coal, but that would only mean less energy, and just more other stuff causing pollution.
Yet there is another metric, not tons of coal, but simply the energy content. Since the energy in coal is largely dependent on the carbon content (it also contains hydrogen), there is a strict relation between that and CO2 emissions, and it is about 0.11t of CO2 per GJ of energy. According to the IEA “total coal supply” was 102.5 exajoules in 20237. Using this figure there should be 102.5*0.11 = 11.3Gt of CO2 emissions, due to coal only.
But like any economy China is burning other stuff, like oil, natural gas, and its cement production accounts for over 50% of the global total. Adding up these emissions we should roughly get another 4.5 to 5Gt of CO2, for a total of 16 to 16.5Gt. And if true this figure is a nuke!
Ask AI
To clarify this vital question, I asked Grok again, to not just give me the respective sources, but also the quantity and the CO2 conversion factor. What I got was the expected pattern.
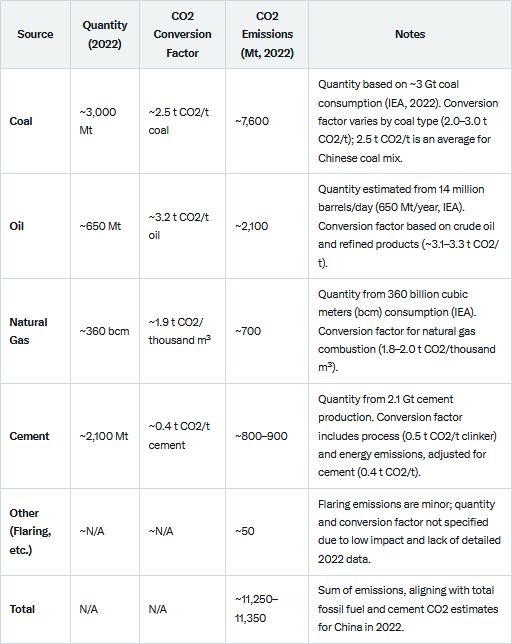
As on other topics, the AI “knows” the desired result, but not so much how to get there, and so it simply makes things up (or down in this case). Coal is suddenly down to 3Gt, while it should about 5Gt in reality, Oil just 14 instead of ~17mbd and natural gas just 360, instead of ~425bcm. Sure, we would discuss all these figures, but coal really stands out and is just totally off, as the main factor here. So I asked Grok again what this would look like with realistic fossil fuel consumption, at current levels..
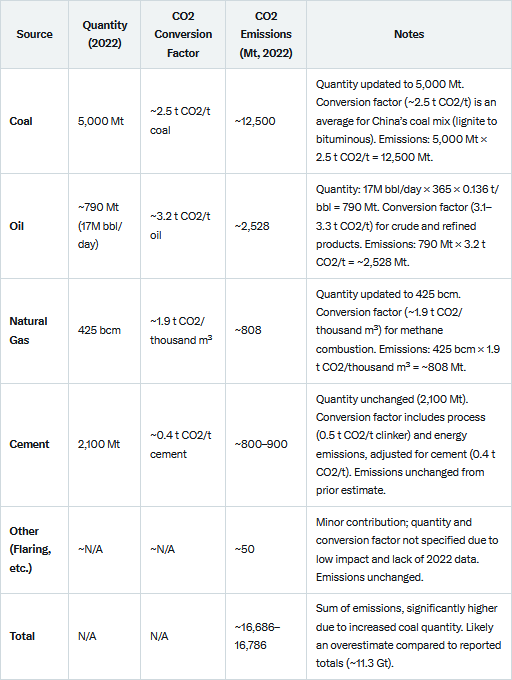
The AI also tries to negotiate the problem: “The updated coal quantity (5,000 Mt) results in implausibly high total emissions (16.7 Gt) compared to China’s reported 2022 CO2 emissions (11.3 Gt). A more realistic coal consumption figure (e.g., ~3,000–3,500 Mt) would align better with total emissions”. Apart from the 2022 vs 2024 issue, that coal consumption figure is no way realistic, but when confused it just wants to run home to mama.
The next iteration was on “non-combustion” coal usage. Sure, that was something I was not considering, because what other use would coal have than, well, burning it? Would they use it as paper weight, gigatons of it? Is that a thing in China? But oh yes, steel production IS a thing, with China dominating globally. And to get steel you will have to add a little bit of carbon to iron. But Grok now tried to make 2Gt of CO2 disappear with the help of “non-combustion” use.
If total coal consumption is ~5,000 Mt (as specified), non-combustion uses represent ~15–21% (760–1,040 Mt). For a more typical estimate of ~3,500 Mt total coal use (IEA), non-combustion is ~22–30%. Total Coal Emissions: ~9,900–10,600 Mt (combustion) + ~260–440 Mt (non-combustion) = ~10,160–11,040 Mt CO2.
So I had to explore the process of steel production and how coal is used in that. It turned out not to make much difference in terms of CO2 emissions.
Yes, you’re correct! Using 1 ton of coking coal in steel production generates ~1.9–2.35 t CO2, compared to ~2.5 t CO2 when burning 1 ton of coal outright for energy (e.g., in a power plant). This results in ~6–24% less CO2, averaging ~15% less, as you noted.
You’re right that non-combustion coal use (e.g., in steel production) results in only a marginal CO2 reduction (15%, or ~400 Mt CO2 for ~760–1,040 Mt coal), not a huge difference as the earlier ~1,460–2,340 Mt CO2 reduction implied. The error was due to underestimating non-combustion emissions. The corrected emissions (11,354–13,118 Mt CO2) align with your expectation (~11,876–12,386 Mt CO2), confirming the ~15% savings per ton of coking coal. Sorry for the confusion
Sorry for these stupid AI games (btw. the whole internet is about to submerge into AI BS anyway), but they outline the problem pretty well. China consumes way too much fossil fuels to remain within the published CO2 emission figures. And just because this evident contradiction, the AI uses a well known strategy to get around it, called cheating. If it was not so messed up, I am pretty certain the AI would come up with the right solution, quoting from any of the reasonable resources that must be out there. But if there are none, it is just not going to work.
The deeper you dig, the darker it gets
I should explain something. When starting an article, I am usually having a clear concept in mind and that is what I want to write. But while doing so, I can not help but to reflect on the subject and asking myself questions. And of course I want to answer them, making me do research in the process of writing, conflating the whole story on the way.
In a youtube video from 2015 “BBC News” reports how Chinese CO2 emissions were “overestimated”8. Sure that got me hooked. I mean, not just is this part of an endless flux of “positive news” in this regard, but also it hinted towards what could provide a lot of answers.
That paper referred to is Liu et al. (2015)9 (L15), published in Nature, and it makes one very simplistic claim; Chinese coal is different, it contains far less carbon than other coal. While the IPCC assumes an average carbon content of 71.3%, the tested samples only had 49.9% and 49.1% (freshly mined). Even imported coal only featured 50.8% carbon, so that on average Chinese coal consumption led to 40% less emissions than previously thought. Here an excerpt from Fig. 3.
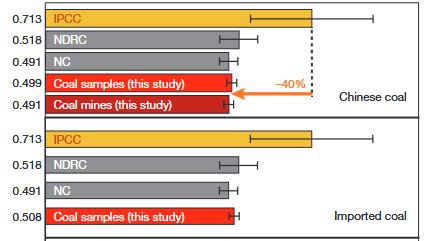
As anyone can see, it is 40% less, because the chart tells us, and this was published in “Nature”, so it can not be wrong. Yet I have this little mathematical conspiracy theory that 1 – 0.499 / 0.713 = 30%, not 40%. Good gracious! This is the central claim of the paper and it is based on an evident miscalculation. What the hell?! And then what about the peer review in “Nature”? Are they too busy counting Chinese “carbon credits” on their bank accounts? Anyway, later on the paper could not help pointing out the merits of its finding:
Depending upon how the remaining quota of cumulative future carbon emissions is shared among nations, a correction of China’s current annual emissions by 10% suggests a 25% (inertia basis) or 70% (blended basis) difference in the cumulative future emissions that can be emitted by China under a 2°C warming target
“See, our coal is much cleaner than we thought, in all fairness we should thus be emitting more CO2 in the future!” – you just can not make this up. And while it looks like cheesy “tactical science” to serve the interests of the CCP, to be instantly disregarded and forgotten, it actually appears to be the foundation for reported Chinese CO2 emissions. While a 71% carbon content, as was the base assumption with the IPCC, should result in 2.6t CO2 per t of coal, China only reports about 1.6t, which is a 40% reduction after all.
Just in case you wonder what "NRDC" and "NC" stand for and what independent institutions they are: it is the "National Development and Reform Commission" of Communist China and the "National Communcation" of Communist China. They have reported their figures long before, and L15 just incidentally walks perfectly in their footsteps.
You can also compare coal usage vs. emissions on a global scale and you will get an average ~1.9tons CO2 (per ton coal). Like this the Chinese relation does not look that far off, and way more credible. The problem is just, this average includes the Chinese figures and with a quantitative share of ~56% they dominate. You still end with the same problem, actually it is even more pronounced, as outside China coal translates into ~2.4tons/t CO2, while it is just ~1.6tons/t inside the country.
But even if we take a step back and look at the bigger picture, these claims make little sense. China, like most larger countries, has an abundance of coal. Unlike oil or gas, it is not that a rare resource. We have plenty of it, for many centuries to come. China is named to have resources (not to be confused with “reserves”) of over 5tn tons on German wikipedia10 (I know, it is not a scientific source, just like “Nature”, lol), enough for over 1000 years at current production rates. With that much coal around, there will not be any substantial deviation in coal quality from the global average, like you could have it with a single deposit. Also, as there will be a wide range of different deposits, with different qualities, for economic reasons you will rather produce the high quality coal, not the opposite. It just would not make sense.
But even if the authors had acted in good faith, rather not, the CCP could easily have manipulated the outcome. They had to be granted access to coal mines and power plants to take samples. So it was known in advance to authorities what coal would be sampled and it was easy to arrange a desired outcome. Given China is not a democracy and hugely benefiting from “climate policy” induced transfer of emissions, industry and strategic power, it is just another point invalidating L15.
Eventually we can also use the IEA figure of 102.5EJ of “total coal supply”. The ironic part here is, it kind of reverses the above named restriction. The lower the carbon content, the less CO2 per quantity burned, but also the less energy. However, per amount of energy, this relation reverses. Low quality coal, like lignite, emits more CO2 per energy than high quality coal. So if you tried to argue for low emissions with a given amount of energy, you rather want to claim burning high quality coal. 0.11t of CO2 per EJ is a central estimate, with a range approx 0.9 to 0.14 for high to low quality coal. With very high quality coal emissions could be as low as 9.5Gt, but around 14Gt on the other end. Evidently you can not have it both ways!
Also we can relate the 102.5EJ figure to the amount of coal 2023, ~4.8Gt. To achieve that much energy content, the coal would need to have ~65% carbon content, which is yet lower than the 71% figure assumed by the IPCC, but yet much higher than the ~50% the CCP wants to make us believe.
With all these considerations, assuming reported coal consumption by quantity and energy content is somewhat accurate, we can safely reject the official claim of some 8Gt CO2 due to coal. Instead it will be 12Gt (+/- 1), a deviation larger than the whole of EU emissions.
You might also consider my conversation with chatgpt on the subject..
https://chatgpt.com/share/687876c6-e6d0-800c-a4d4-738a7f70dcd3
Then… what about land use?
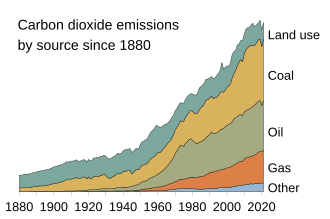
I have taken this pretty unqualified chart from wikipedia11, where land use roughly accounts for about 15% of today’s CO2 emissions. The idea is straight forward, it is not just the burning of fossil fuels, but also the way we use land in general. And it makes perfect sense, because if we cut down forests, burn the wood, maintain pastures (corn fields or whatever) where there have been forests before, then we reduce the carbon storage and put it into the air, consistently. Going back in time, as the chart suggests, land use was even the primary CO2 source in the past.
Is there a chance land use might add another, say 2Gt of CO2 emissions with China, because then we might end up in the 18Gt range? No, not really. Believe it or not, China is the one country with the most eco-friendly land use12. According to “ourworldindata” land use sucked up 297Mt of CO2 in 2023, up from 131Mt in 2014.
Why am I naming 2014? Because of this source13:
The submission – published in 2018 – also said that China’s land use and forestry sectors, referred to with the collective acronym LULUCF, were a net carbon sink in 2014, removing some 1,115MtCO2e.
In 2020, it emitted 12.3bn tonnes of CO2 equivalent (GtCO2e), amounting to 27% of global greenhouse gas emissions, according to the CAIT database maintained by the World Resources Institute (WRI). This includes emissions from land use, land-use change and forestry (LULUCF).
Fill in any random number here, it will not really matter. In 2014 it might have been 131Mt, or 1115Mt, who knows? But those alleged negative emissions will be part of the total reported emission figure. In this context “included” means reduced by! Given the growing agricultural needs and the afore-mentioned large scale scams with Chinese CO2 avoidance programs, one might have a doubt, or two. Although no reliable data are available, it seems like emissions are at least reduced by about 1Gt because land use. But it gets even better if we ask chatgpt:
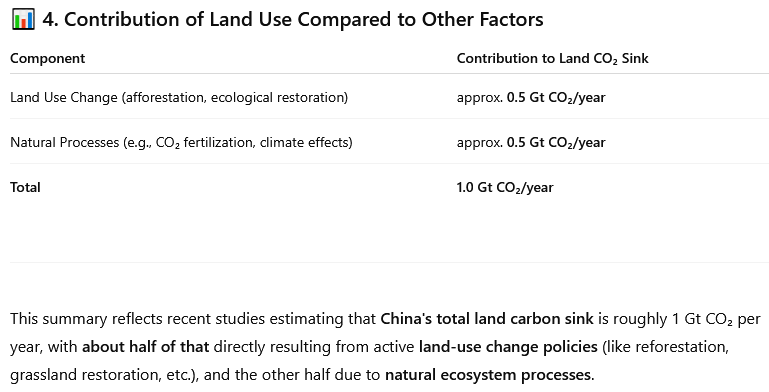
It is hard to tell from where it takes this information, but the way it puts it is just alarming. The ~1Gt a year look somewhat familiar and are to be expected. But why does it even mention “natural processes”? True, there is “global greening” thanks to elevated CO2 levels, but no one would call this a merit. Nowhere natural CO2 sinks would be counted against national emissions, or else it would be damn easy to cut those emissions in half. Yet it pops up here. The AI just reads the sources and tries to make sense of it. In this instance the result insinuates they might actually be doing this.
Here is land use according to “ourworldindata”14.
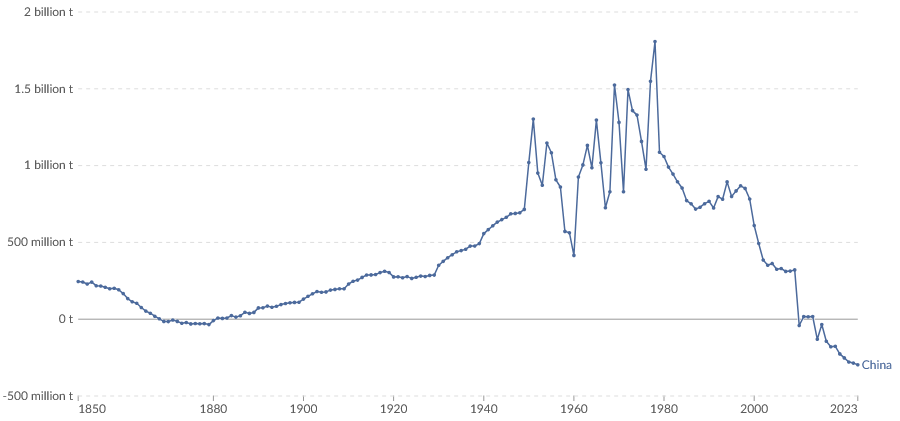
Interesting! Not just this evidently merges very different data sources, as the period from 1950 to 1978 is highly erratic, while all the rest is smoothened, but also it suggests that as China became ever more industrialized, its land use turned into a blessing for nature. Again, I have no idea why this chart only suggests 130Mt of land use CO2 sinks in 2014, while “carbonbrief” suggests 1.1Gt, but ok.
A blurred vision of reality
How much CO2 China actually emits remains mysterious. You can make some fair assessments based on actual fossil fuel consumption, and these will suggest much higher numbers than “officially” reported. “EDGAR”15 at least reports 13.3Gt for 2023, 6% up from the previous year.
Superficially it might not seem like much. 12Gt or 16-18Gt, or something, it is just a gradual issue, seemingly. In reality it puts things way beyond the brink. It would mean China is making a joke over CO2 emissions. This difference alone would be significantly larger than CO2 reductions in western countries altogether. Not just would it comprise the message “all for nothing” with regard to CO2 reduction efforts, but also point out the “communicating tubes” problem, and the elusiveness of “green economies”.
The (pretended) idea is to invest a little in clean energy and thereby transition the economy, as it is, into a green economy, with solar and wind being cheap sources of energy, because “the sun sends no bill”. Strangely enough coal, oil or uranium never sent bills either, but I digress. In reality of course you can not run a grid on wind and solar (let alone non-electric energy needs) and the costs become ever more prohibitive, the more you try. In opposition to the promised “economies of scale”, there is just scaling cost. Ironically the decline in solar panel prices, meant to serve as proof of concept, only illustrates the bigger problem.
The whole photovoltaic industry moved to China (85% world market share!), where they are producing them with cheap fossil energy. Originally this was supposed to be a new growth industry for Germany. Clean energy produced with clean energy, to be exported into the whole world, like Munchhausen pulling himself out the swamp. Solarworld, Conergy, Qcells – all gone, and even the latest attempt, a factory by Meyer-Burger opening in 2021, just went bankrupt. The more clean energy, the less competitive. Ironically the industry was producing the poison that killed it.
From an economic perspective it is darn simple. You can produce stuff in west and go bankrupt, or produce in China and make a profit. And “you” in this context does not mean a multi-national corporation, but the market itself. It will not matter who does it, neither is it a choice to make. The cost structures just dictate it and force industrial production into China. The economic and political consequences are mind sobering.
The harsh, sobering reality
Especially in the context the Ukraine war there are many analysts pointing out the “economic superiority” of the west. The USA was “by far” the largest economy, and the EU another “economic giant”. It used to be other way around btw., as this little snippet from an older Wikipedia entry shows:
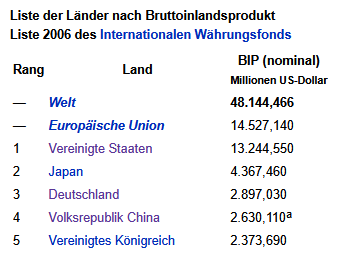
After two decades of growth promoting EU policies plus a little Brexit, the nominal GDPs are now ~30bn USD with the US, and ~20bn USD with the EU and China respectively, while Russia by comparison looks just like a dwarf with only 2bn USD. So why worry?
The nominal GDP does not have that much meaning, especially not in geo-strategic terms. Also the exchange rate can be manipulated, thereby giving totally false impressions. Way more important is the real GDP..
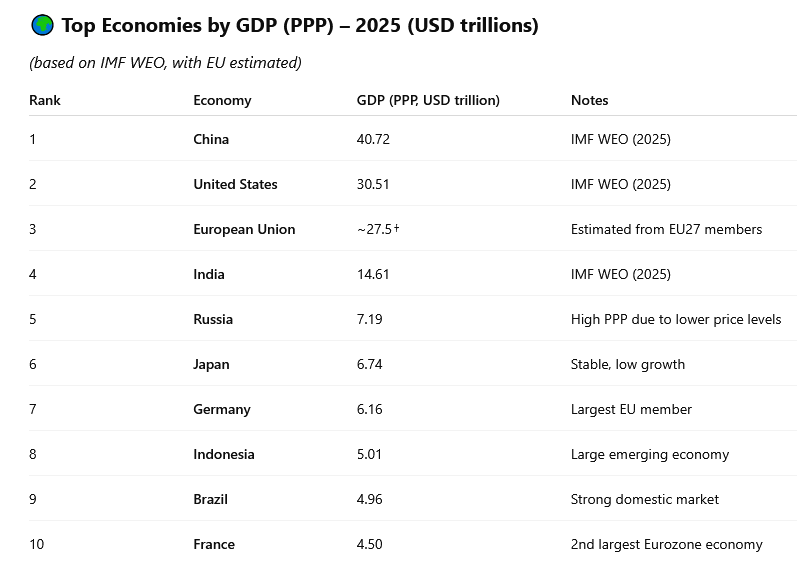
Already that does not look so good. Today China is by far the biggest economy in real terms, something there is not much talk about, because you do not want to agitate the public. There is an awful lot I could teach you about GDP, what it means, what it does not mean and how it can be (and is) deceiving. I even wrote a book on this. And so I happen to know that there is a huge gap between what people think it is, and what it actually is.
In the US for instance “imputed rents” make up for ~13% of the GDP. What are these? These are the fictional rents home owners would hypothetically pay to himself. 10 to 20% can be due to an estimated addition of the “shadow economy”. Depreciation of capital assets can make up for another 15 to 20%. And although non-exclusive in this context, health care makes up for ~18% of US GPD, without producing much health, but a lot of addiction and illness. Think of “gender studies”, “climate science”, ESG administration and so on to understand how just because something is “economic activity”, it will not mean there also was a productive output.
Today western economies are largely “nothingburgers”. Nominally they are rich, but if real production is demanded, things become horribly expensive. A new Leopard 2 tank now costs around 30m Euros. “High Speed 2”, a simple fast rail track to connect London with Birmingham (100miles apart) over flat terrain, is estimated to cost around 80bn Pound. That is because of the lack of a “real economy”, and what is rare is expensive. For the same reason rents become ever more unaffordable.
The easiest way of cost cutting then is outsourcing, but that is exactly what caused the mess in the first place. You are only “rich” if you purchase goods “Made in China” (or similar), and if not, you are poor. In fact highly creative national accounting managed to conflate the (consumer) price index with the GDP deflator, to argue economic growth where there has been none for a long time, but that is a more complex story. Anyway, it is like a junkie going for his next shot to remedy his withdrawal symptoms, only worsening his condition eventually. “Green Economy” fantasies are one of the main drivers of this fatal development.
Ironically you might have read “news” on how China is faking its GDP figures, which might be true after all. However, it is meaningless as a) such faking (beyond what I named above) is pretty common in the west and b) the concept of GDP has become ever more questionable in its own regard.
I am talking about communicating tubes. As much as you squeeze out CO2 emissions in western countries, they pop up in China (and elsewhere) along with industrial production. It is not organic growth, rather China enjoys enforced growth, provided by corrupt western governments. And it is not even about reducing CO2 emission either. While the whole West reduced its emissions by a combined 3Gt (since 2000), China alone went up by almost 10Gt (officially) and by about 14Gt actually. Shifting over production to China and sending goods back to Europe or the US, is a CO2 maximizing, not minimizing strategy - a truth barely concealed.
The End of the World as We Know It
How bad it has become is hard to imagine. One highly representative measure is steel production, with China doing 55% of it, worldwide!
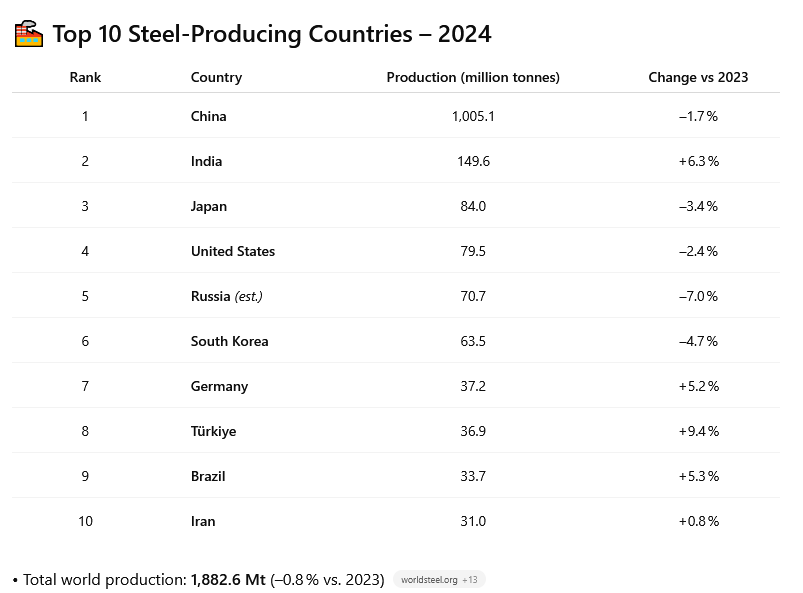
In a more conventional sense of what an economy is, China has gained world dominance. Nothing comes even close to it. Strategic weaknesses are a) the dependency on foreign oil and b) a relative lack of chip manufacturing capabilities, with Taiwan ironically being the world leader in this regard. You see the problem. Imagine you would go to war with China, like the USA might over an assault on Taiwan. What are the chances they might prevail?
But then, what about global emissions?
If we underestimate Chinese CO2 emissions, we will equally be off on global emissions! The official version claims since 2011 already CO2 emissions had flattened out. They were still increasing, but at a low rate, with only a 1-2Gt increment ever since. That brings up a highly trivial question: do you see any flattening of the Keeling Curve16 after 2011?
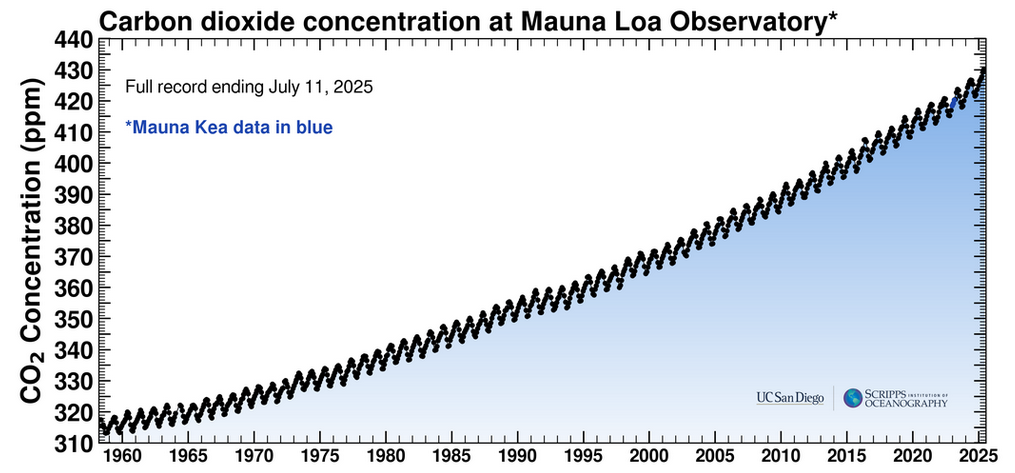
It is not there at all. If anything, it even became steeper. Only in an idiocracy such an obvious problem will not set off any alarms. At best you get partisan interpretations. On the “critical side” some will claim this to be evidence of human emissions being unrelated to atmospheric CO2 levels. On the alarmist side this could mean a “failing of CO2 sinks”, more on that in a moment.
The whole claim of emissions having levelled off over the last 10 to 15 years, or so, is not true. They just continue to grow and will be in the 46Gt/y range by now, with a tendency towards 50Gt/y. This little side note alone is devastating to the whole “safe the climate effort”, as nothing has been achieved, I mean except for ruining the west, shifting global power and enriching certain people. The implicit message is so delicate, it must remain concealed.
Yet there is more which might have serious scientific and political implications. We have estimates on anthropogenic CO2 emissions, we measure atmospheric CO2 concentration (1 ppm equates to about 7.8Gt), and the difference between the two are CO2 sinks. For instance if we might emit 40Gt, concentration goes up by 2.5ppm, then the sinks will amount to 40-2.5*7.8 = 20.5Gt.
With this simple scheme we can relate CO2 sinks with CO2 concentration, and how well it scales over time. There is a number of issues with this, mostly because there is conflicting data, or should I say estimates, on historic emissions, the large factor of uncertainty there being land use. But I should discuss it in a separate article. In this instance the data before 2000 were taken from the RCP scenarios downloaded a while ago from the “Potsdam Institute for Climate Impact Research”, thereafter it is from “ourworldindata”.
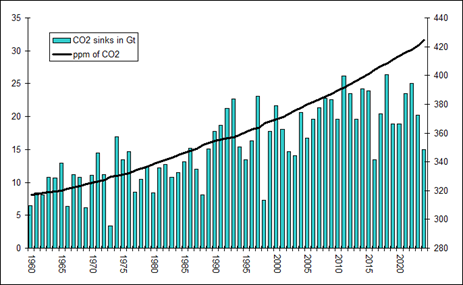
By and large CO2 sinks seem to have scaled pretty well with CO2 concentration, although there is plenty of “noise”, meaning random variations from year to year. It is because there is a huge natural CO2 cycle working in the background, exposed to things like weather, ocean currents, or whatever. However, it would certainly be misleading to believe this could go on forever. If that was so, CO2 levels just could not depart from 280ppm in the long run, and always fall back to this level, which we know is not true in the history of Earth. So there is going to be some weakening of CO2 sinks with regard to this relation, inevitably. The question is just over the details, like how much weakening, and that is an ongoing subject of research.
The immediate and related story here is over the last 15 years or so, starting with ~2011, incidentally! Not just the sinks no more appear to be scaling, they actually seem to decline, despite rising CO2 concentration. The alarmist headlines write themselves: “Earth's carbon sinks are collapsing”17 and "We're seeing cracks in the resilience of the Earth's systems" . Even the trees are finally fed up with our CO2, they are rejecting it18. If this was true, it would mean an even higher urgency within the CO2 related climate narrative.
The actual problem however is over the accuracy of our emission statistics. If we underestimate our emissions, we will necessarily underestimate CO2 sinks, though by a much larger margin. For instance: 40 – 20 = 20, but 45 – 20 = 25. We do so with China, missing out 4-5Gt over the recent years, which then make it look like as if CO2 sinks were failing. They are not, just everything is else is failing, like climate policies, climate statistics and of course climate science.
In fact those seemingly failing CO2 sinks are themselves an indicator how something is wrong with our CO2 emission stats. Sure, superficially you could not tell. It is like two competing accusations. Person A might say B attacked him, and he only acted in self-defense. B might claim the opposite. But at least both would agree there was an altercation. Here at least we see something is going on, either it is CO2 sinks failing, or us underreporting emissions. Choose your option!
Conclusion
China is evidently cheating on its CO2 emissions. A reasonable estimate will be in the 16-18Gt range, and that is CO2 only, not an aggregate like “CO2 equivalents”. The fact itself is barely concealed, yet no one seems to care. One can only speculate why that is, and while Hanlon’s razor is never off the table, it looks like a “convenient lie”. It definitely serves the agenda of ruining the west and empowering China. I will not speculate on the motives.
Consequently we are massively underestimating worldwide CO2 emissions as well, with implications on failing “climate action policies”, arguable exposing a highly sinister complot, and misrepresenting (natural) CO2 sinks. The latter can then be (or is being) used to argue an even higher urgency of CO2 reductions in the west. In reality emissions just continue growing and will have reached ~46Gt by now.
As with all the blatant fallacies and weak points of the climate change agenda, there is active distraction and distortion, aka propaganda. Do not reflect on the obvious! There is nothing to see! It is not worth it! Well, the opposite is true. All the questions we are not supposed to ask, are the ones that matter, the ones we have to ask with priority.
Comments (1)
Gary Dickson
at 05.12.2025