

Methane
Methane, as you all will know, is a greenhouse gas, next to being a by-product of digestion by cows, as well as our own. Remarkably that is about where the knowledge ends, as there is an awful lot of nonsense circulating on the subject, originating both from the consensus as the critical side. So let me have short and simple review on the subject that even the ordinary reader should be able to comprehend. You know, the simple things..
The common narrative
Over 20 years, the methane would trap about 80 times as much heat as the CO2. Over 100 years, that original ton of methane would trap about 28 times as much heat as the ton of CO2.2
Why this difference? Why 80 times, and then just 28 times? It is because methane decays relatively fast and only has a lifespan of about 10 years (more on that later), if that is true. Decay in this instance means the CH4 molecule eventually oxidizes into CO2 and H2O, under the addition of oxygen obviously (skipping the exact chemistry). While this will lead to two other GHGs, it is kind of a minor issue as they are relatively abundant anyway.
Anthropogenic methane comes predominantly from fossil fuel production. For some time, with the focus on more attractive oil, the by-product methane was simply let go into the air. Today we are producing over 3Gt of natural gas per year of which some always gets “lost”, but also oil and coal production comes with emissions. Ruminants as lifestock are considered another large anthropogenic source, followed by landfills and rice(?).
With methane being such a powerful greenhouse gas, there is a threat of some pivotal tipping points. Permafrost holds substantial amounts of methane that could get released if it all was to thaw. Even more importantly there are huge amounts of methane hydrate, a solid and frozen shape of methane, at the ocean floor. In a way it is caught there due to pressure and low temperature. But should even fractions of it convert into its gaseous state, due to warming, bubbles would shape and provide uplift to large chunks of it. Once they approach the surface all of it converts to gas and ends up in the atmosphere. In fact this may actually happen from time to time, thereby threatening, or even sinking ships.
But before we dive into the Bermuda triangle, let us get back to stone cold reality. While the “official” information I just gave sounds pretty scary, it is not even half the truth. The other half, as I just checked via search function on WUWT, can not be found on the critical side. Yes there are some assertions how methane was not a problem, but these follow common patterns of incompetence and irrelevance. So let us do some reality check.
The radiative transfer model
If we ask modtran2, we get some reasonable and intriguing information. Why not simply compare the GH-potential of methane with CO2? Let us start with the US std scenario devoid of both CO2 and CH4. Under these circumstances emissions TOA would be 260.9W/m2.

Once we introduce 400ppm of CO2 these emissions drop to 240.1W/m2, which is a 20.8W/m2 delta. I have already gone into the question how much CO2 contributes to the GHE in much greater detail and the figures there deviate a little bit. Here it is simplified and just meant to provide a common ground. This CO2 figure however is not far off anyway.
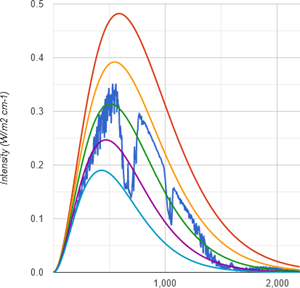
Doing the same with methane, that is an unimaginable concentration of 400ppm of CH4, because comparing apples with apples, emissions are 251W/m2. This means a delta of 9.9W/m2. The imprint of CH4 is predominantly in the range of wavenumber 1.200 to 1.400, and a bit to the right.
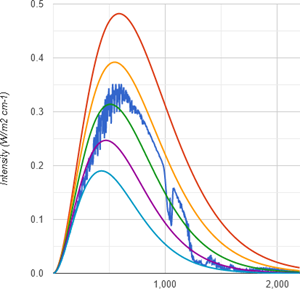
It turns out methane is only half the GHG CO2 is. Not just does it lack any overwhelming optical thickness by comparison, but the main absorption band is in a region of the emission spectrum that is simply less intense. So, despite of what you may believe, at identical concentrations methane is a far less potent GHG than CO2.
A more detailed analysis (What CO2 forcing?)
When we try to relate the instantaneous CH4 forcing to that of CO2, that means ignoring any time component, we first of all run into the problem well discussed before. What CO2 forcing? “Climate science” to this day has not realized it has an ambiguous understanding of CO2 forcing and that is a travesty.
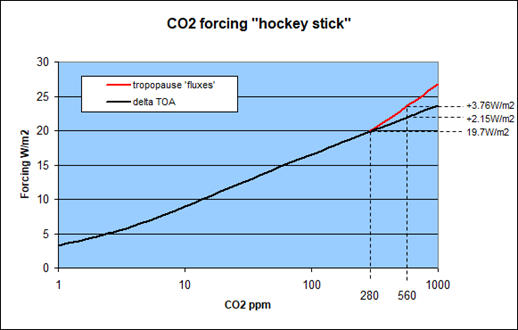
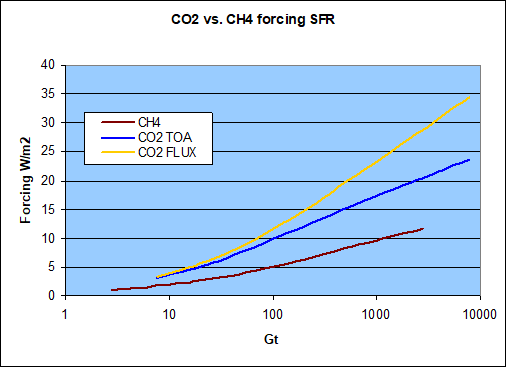
There is the TOA (top of the atmosphere) approach used to name the CO2 forcing in general, like how much the given or natural CO2 contributes to the GHE. That approach will be used when attributing the share of CO2 in the GHE, like with Schmidt et al 20103. With this approach we get about 21W/m2 in net forcing and a slope of 2.15W/m2 for a doubling of CO2, equally net.
The “flux approach” on the other side is based on the concept adding up the “fluxes” at the tropopause in absolute numbers. That is the decrease in “upwelling” radiation plus the increase in “downwelling” radiation. With this approach the net CO2 forcing was about 30W/m2 net with given concentrations and a doubling would yield about the canonical 3.7W/m2.
In any real science, especially if there was a “consensus”, you would need to pick one approach and clarify the contradiction. However, since making such a choice would come with a dilemma downstream, “climate science” has opted to ignore it. Although I will admit it might not be by intent, cause Hanlon’s razor. The “critical side” is equally not discussing this blunder because they have no clue and are too occupied with “flat-Earth science”. And that contradiction is what got is this little “hockey stick” here..
Notably with methane there is very little difference between the two approaches. While you would get some additional “back radiation” from the stratosphere using “fluxes”, the delta in upwelling radiation at the tropopause actually becomes smaller than TOA. At (unrealisticly) high CH4 concentrations like 400ppm this might cause a difference of up to 10%, but even this would be practially mitigated by stratospheric cooling, mainly due to CO2. It matters even less with lower and realistic concentrations and so it should all be pretty negligible.
So to get the full picture, let us compare methane forcing to both CO2 forcing concepts. Relative to the CO2 “flux” forcing methane only yields about 33%. And as above, in terms of its impact TOA, methane is doing no more than a 50% of CO2, although that figure shrinks equally towards 1/3 at actual low concentrations.
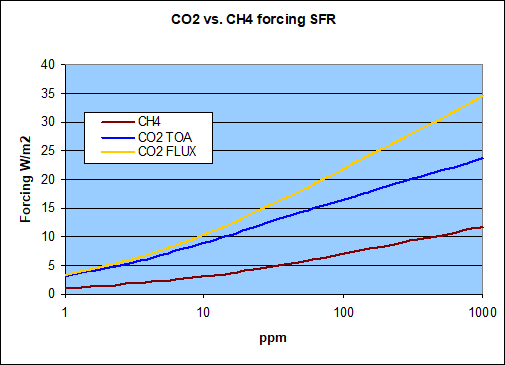
This however is true for concentrations, not for mass. The whole relation changes a little once we consider the chemical structures both of CH4 and CO2. The atomic mass of C is 12, that of O is 16, and that of H just 1. The molar mass of CO2 thus is 44, that of CH4 only 16. As a consequence for a ton (gram, Gt, whatever metric) of the respective agent you get 2.75 times the concentration of CH4 as compared to CO2.
So if we transfer these forcing onto a gigaton scale within the atmosphere, would that not change the relation? The answer is not much! Please note one ppm of atmospheric CO2 equates to about 7.82Gt, while one ppm of CH4 is about 2.84Gt in theory. The atmosphere has a mass of about 5.1e15 tons and with an average molar mass of ~29 vs. 16 with CH4, and so 5.1e148 * 16 / 29 * 0.000001 = 2.84e9. The literature however names somewhat lower figures, like 2.75 (IPCC) to 2.77Gt, because methane concentration drops substantially in the stratosphere. So it would be 2.84 for one ppm throughout the atmosphere and ~2.76 for ground level concentration only. It will no really matter. I will stick with 2.76 figure thereafter just to distinguish it from the 2.75 CO2/CH4 mass relation.
I know this could possibly be confusing. Given methane forcing is only about 1/3 of that of CO2 by concentration, and the mass relation is 1:2.75, this might seem to almost cancel out, and in a way it does. For instance, at 100ppm there would be 276Gt of methane, with a net forcing of 7W/m2. The same concentration of CO2 would go along with about 782Gt an ~22W/m2 in forcing (flux). Per Gt those figures are pretty close by, with 0.025W/m2/Gt of CH4 and 0.028W/m2/Gt of CO2.
However, that is just seemingly almost equal and more driven by the implicit logarithmic nature of such forcings, than any mass relation. With a 275ppm of methane the mass relation would indeed balance out, but then there is only an additional 2W/m2 forcing, bringing the total to 9W/m2, still a long shot from the 22W/m2 the equivalent mass of CO2 does. And so, by any metrics, methane is and remains a far lesser GHG than CO2.
What actually distinguishes CH4 from CO2 is its low concentration of only 1,900ppb (parts per billion), or 1.9ppm respectively. It is its scarcity which makes it seemingly potent. On the logarithmic scale it is far to the left, where small absolute changes provide relatively strong forcings. It is the same thing as with CO2 itself, where the first ppm does over 400times the forcing of the 400th ppm, with the second and third still doing 170 and 120times as much respectively. As with AR6 total anthropogenic CH4 forcing would stand at 0.54W/m2 (0.544 to be exact4) for the year 2019, a figure consistent with the charts above. While this would represent a CH4 increase of only 1.2ppm (from 0.7 to 1.9ppm), it of course also means a growth by a factor of 2.7. A 2.7fold increase of CO2 on the other side, according to the consensus position, would provide a forcing of F = 5.35 * ln (2.7) = 5.3W/m2, almost ten times as much.
The Exaggeration
Sure we could go on discussing the magical mysteries of the logarithm, yet I think these are issues anyone with a high school degree should be able to figure out for himself. But there is more misinformation out there. For instance there is this idea of methane having a “4 to 9%” share in the GHE. You could find this figure both on the German5 as on the English Wikipedia6.
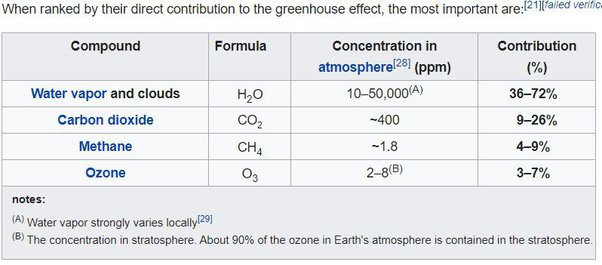
I do not know where such figures come from. All links provided are eventually dead ends, not giving any info on methane. It looks like an urban myth simply circulating with no one knowing how it started. Rather, and in this instance I have no objections, Schmidt et al 20102 has the share of methane at 0.7% net, and 1.6% gross, consistent with modtran btw. Obviously there is quite a difference between these figures and in reality methane is indeed just a minor GHG.
Maybe someone calculated like this: if methane is (or rather was) at 1.8ppm and CO2 at 400ppm and methane is 80times as potent as CO2, then 1.8ppm of methane should equal 144ppm (= 1.8 * 80) of CO2. Then if CO2 constitutes for 9-26% of the GHE, a figure equally wrong, but put on wikipedia before, and you multiply this range by 0.36 (144/400), you get 3.24% - 9.36%. Oh yes, that makes a lot of sense. Never underestimate the naivety of “climate science” followers. LOL!
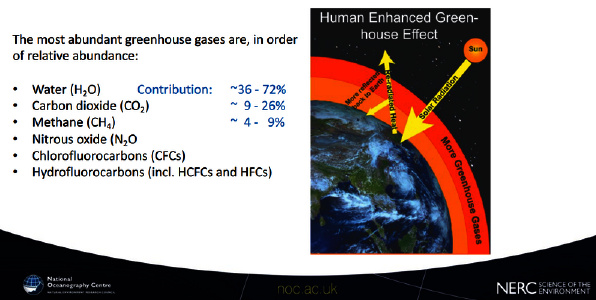
In the meanwhile, due my initiative, this nonsense was finally removed from wikipedia, where it was up for about 16(!) years. Is it thinkable no “climate scientist” ever looked it up? There certainly are lots of “climate activists” wary about any entries not true to “the science” they believe in. Is it possible they have no clue, and probably do not care what that science says? To make matters worse, you can even find “scientific” papers7, educational material8 or a presentation by the venerable National Oceanography Centre of the UK9 (chart below), all brainlessly quoting wikipedia, barely referencing it. These are supposed to be sources doing proper research, rather than totally incompetent echo chambers. This is reality kicking in, and it is just one glimpse behind the curtain of a con-art.
A very short life
What is the actual life time of methane in the atmosphere? If you are not familiar with the technical terms, any google research must be horribly confusing. The IPCC names a “perturbation lifetime” of 12.4 years. What is a perturbation lifetime?
The perturbation lifetime is related to the atmospheric lifetime as τpert = f * τtotal where f is the feedback factor and is calculated as f = 1/(1-s), where s = δ (ln τtotal)/δ (ln[CH4]) (Prather et al., 2001). Since there are no observational constraints for either τpert or f, these quantities are derived from CCMs or ESMs. AR5 used f = 1.34 ± 0.06 based on a combination of multi-model (mostly CTMs and a few CCMs) estimates (Holmes et al., 2013).10
Ok, it is the life time times 1.34, so that the actual life time will be 9.25 years. The deal with “perturbation lifetime” is yet to come. Lifetime itself means, so to say, the life expectancy of an individual CH4 molecule within the atmosphere. The important part is not to confuse it with the term half life, we are familiar with from radioactive decay. An unstable atom will have a certain likelihood to decay over a certain period, but that likelihood stays constant, regardless how old it is. Over the half life period the atom (as the whole population) has a 50% chance to decay. In the following period however not the remaining 50% will decay, but only 25%, then 12.5%, and so forth. Individual atoms may exceed the half life by a factor of 10 or more. Because of it life time is longer than half life and the difference is ln(2) and so half life = lifetime * ln(2).
It follows from these parameters that the half life of methane in the atmosphere is only 9.25 * ln(2) = 6.4 years. And these 6.4 years equate to an annual loss rate of 10.25%. If you remove 10.25% of something time after time, doing 6.4times will leave with 50% of it.
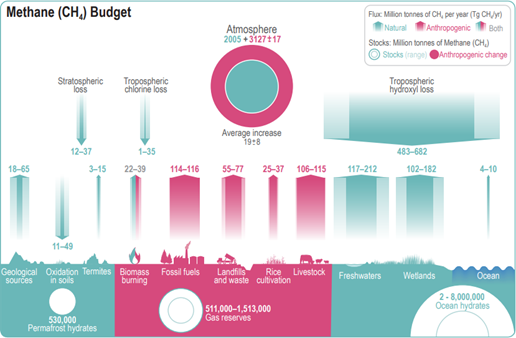
Something very similar, although not identical, goes for the methane budget shown by the IPCC. Here we would have about 5,132Mt of CH4 in the atmosphere (still based on ~1,800ppm back then). All uncertainties aside, AR6 assumes some 591Mt of CH4 sinks a year over the period 2008-2017, as shown in table 5.2. The chart gives a mean figure of 582.5Mt just for hydroxyl loss by the way.
With these figures the annual loss would rather amount to 11.35% (=582.5 / 5132), and the half life could only be 5.75years (= log 0.5 / log (1 – 582.5 / 5100)). Also, notably, the pre-industrial methane level would be 730ppm. Anyway, despite substantial margins of uncertainty, the figures do not quite match. That is not a problem, nothing to be critical about, it just important to see the context. These are all just estimates to be taken with a grain of salt and all over the half life of methane will be about 6 years. There is no use in having a decimal fetish and pretending high precision, when the basics are not that clear. Yet this is exactly what we encounter in many publications, which add a lot speculation and almost esoteric assumptions on top and eventually come up with definite, exact results. You will see what I mean.
The instantaneous forcing
Before dealing with the “forcing potential” over a certain period, let us first look at the instant forcing, because I think there are some problems. Above I already discussed the more general forcing properties of CH4, but of course these considerations were of more theoretical nature. We will never get 100 or so ppm of methane anyway. Let us focus now on those concentrations that are practically relevant.
Analyzing modtran data back and forth, the chart below is the result. At 700ppb the forcing is 0.86W/m2, at 1,800ppb it is 1.42 (both highlighted in red). Note the CH4 concentration went closer to 1,900ppb just after AR6 was released. The difference of 0.56W/m2 is almost exactly what AR6 names for anthropogenic methane forcing (0.54W/m2). Given they assume 730ppb (= 2005 / 2.76) for pre-industrial both figures are really within the margin of error. Basically it is a perfect match, and it should be.
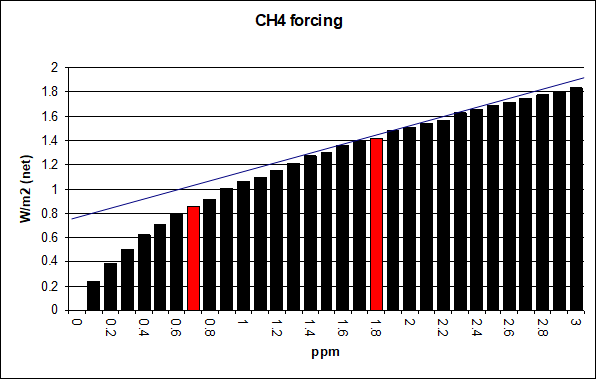
For that reason I can also confidently tell the slope of methane forcing (or marginal forcing), at its given concentration, will be ~0.38W/m2 per ppm. Of course ppm is still a way too large measure, because adding a whole ppm would considerably flatten the curve further. Also, if we’d go back to 700ppb, there the slope would rather be ~0.7W/m2. And yet 1,100ppb increment from there on did not yield 0.77W/m2, but only 0.56W/m2, or 0.54W/m2 respectively. The marginal forcing decreases just quite fast.
With that we have interesting background info on some of the literature. We have Edwards, Trancik 201411
“CH4 has 102 times the radiative forcing per gram of CO2”
Balcombe et al 201812:
“methane has a radiative forcing approximately 120 times more than CO2 immediately after it is emitted”
..or Neubauer; Megonigal 201513 who only offer a graph where a pulse emission of 1kg of CH4 is supposed to do about 210W/m2e-15 (Figure 2). The chart also features the pulse emission of one kg of CO2 yielding about 1.8W/m2e-15, a figure also named in the text.
I would love to add the figure named in AR6 at this point, but I just could not find and I tend to believe it is just not there. Anyway, the task here is to get the named references into context and translate them from cryptic.
The first two references are easy to comprehend, once we consider the iconic CO2 forcing function is 5.35 * ln (C1/C0) AND the molar mass relation of 1:2.75. At 400ppm of CO2 a gradual increase by 1ppm will do a forcing of 5.35 * ln (401/400) = 0.0134W/m2. Multiplying that figure with 102 and dividing by 2.75 gives us 0.5W/m2 for one ppm of methane. The same procedure applied on the 120times figure gives us 0.58W/m2.
With the last paper we have approximate figures for both. One ppm of methane then equates to 2.76Gt, or 2.76e12 kg. If one kg did 210W/m2e-15, one ppm would (again) do ~0.58W/m2 ( = 210e-15 * 2.76e12). The CO2 figure of 1.8W/m2e-15 is to be multiplied by 7.82e12 to attain the forcing of a single ppm, resulting in 0.014W/m2. This is just a little larger than the 0.0134W/m2 named above and equates to 3.9W/m2 for 2xCO2, well within the range of common estimates.
What all these papers have in common is a total lack of context. They just state a certain figure, cryptic in a way, and will not explain under which assumptions they have been attained. We know already, and again I can state this with high confidence, the actual CH4 forcing at current concentration is only about 0.38W/m2 per ppm.
Why that difference?
So why would all these papers claim a much higher number? There are two ideas that came to my mind. At only 700ppb the marginal forcing is like 0.7W/m2, so maybe they stuck somewhere in the past and did update their figures to current concentrations. Or alternatively it is meant to give a weighted average over the whole of elevated methane levels do to human activities. I mean it could be. Or possibly they just ignored clouds. The thing about radiative transfer models is that they do not come with any reasonable out-of-the-box cloud model. This will be something you have to properly figure out for yourself and for many this remains an insurmountable hurdle. Without the cloud overlap I get around 0.58W/m2 per ppm, even with current concentrations, highly consistent with at least two of the papers.
There is yet another more transcendent, mysterious possibility. As Homes et al 201214 have it..
Accounting for both direct and indirect effects, the methane RF efficiency, Fe, is 620 mW m−2 ppm(CH4) −1 in steady-state.
What exactly is the indirect effect of a radiative forcing, that still happens to be a radiative forcing??? The same source clarifies..
The methane GWP customarily accounts for the direct RF from the emitted gas, as well as indirect RF caused by methane-induced increases in ozone, stratospheric water vapor, and feedback on the methane lifetime (Forster et al.,2007).
Ok! So methane would increase ozone, a GHG on its own and stratospheric WV which is supposed to cool the stratosphere and warm the troposphere by some assumed automatism. Most of all however it is supposed to enhance its own lifetime. The IPCC on this issue:
Increased methane leads to tropospheric ozone production and increased stratospheric water vapour, so that an attribution of forcing to methane emissions gives a larger effect than that directly from the methane concentration itself.
For methane emissions, in addition to their direct effect, there are indirect positive ERFs from methane enhancing its own lifetime, causing ozone production, enhancing stratospheric water vapour, and influencing aerosols and the lifetimes of HCFCs and HFCs (Myhre et al., 2013; O’Connor et al., 2021). The ERF from methane emissions is considerably higher than the ERF estimate resulting from its abundance change. The central estimate with the very likely range is 1.19 [0.81 to 1.58] W m–2 for the emissions-based estimate compared with 0.54 W m–2 for the abundance-based estimate (Section 7.3.5).
But also..
Ozone-depleting substances, such as N2O and halocarbons, cause a reduction in stratospheric ozone, which affects ozone and OH production in the troposphere through ultraviolet radiation changes (and thus affect methane).
At this point you might feel like a brick dropped onto your head. And indeed these some avant-garde claims, but we have to take them seriously. We need to break this down into the different components. Yes, methane will end up as CO2 and so methane emissions are kind of carbon emissions and I can take this into account. On the other side I can barely express my disinterest into how methane might possibly influence stratospheric water vapor and all the not so grounded considerations on how this would affect global climate. At least there will be two points in question that I am more than willing to deal with.
The hydroxyl CH4 sink
Methane is supposed to enhance its own lifetime because using up the hydroxyl sink. Hydroxyl radicals are the “purifier” of the atmosphere, kind of an immune system. Just like ozone, they are caused by high energy short wave radiation, also known as ultraviolet. This UV radiation has the property of adding energy to chemical compounds and thereby allowing for different molecular combinations. I know, this is not specific for a certain wavelength, but anyhow. They are effectively produced by sunlight and bind with almost anything that is not “pure”. To make this more comprehensible and less “creationist”, think of it like this agent having been there for a long time, doing its job. Whatever, natural or not, fits its pattern, has been removed from the atmosphere and life just adapted to the environment.
The hydroxyl capacity of the atmosphere is huge and can not be easily overwhelmed by methane. The idea methane would deplete it is somewhat questionable. More importantly there is some contradiction in the data presented here. The methane budget above suggests 2005Mt of pre-industrial atmospheric concentration and 3127Mt of added, as a central estimate. That is a relation of 39% to 61%. This is, despite all the uncertainties, pretty much the same relation as natural to anthropogenic CH4 emissions. While this may sound fair and square in the first place, it also implies a pivotal logic. If natural methane emissions entertain(ed) a proportionate amount of atmospheric methane concentration as anthropogenic emissions do, then the lifetime of methane must have remained constant. This chart lent from wikipedia15 only clarifies the confusion..
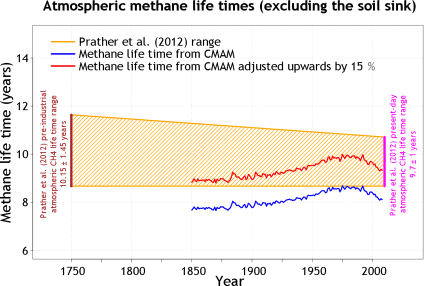
What these data suggest is an actual reduction(!) of methane lifetime to only about 8 years, equivalent to a half life of only 5.5 years. The shaded area gives estimates for earlier, partially pre-industrial lifetime, which was longer! This, the methane budget of the IPCC and many other sources all tell the same story of persistently strong CH4 sinks NOT getting depleted. Yet when assessing the effective radiative forcing, the “perturbation” lifetime, or the “forcing potential”, we have this huge markup on lifetime that does not exist for real.
It is really hard to fathom. You have reality, or rather the best estimates on what reality is on the one side, and an unsubstantiated theory on the other side. Which one will “climate science” follow? Yes, of course the unsubstantiated theory, despite it is contradicting the very data. The IPCC even formulates this logical impossibility:
Perturbation lifetime is longer than the total atmospheric lifetime of methane, as an increase in methane emissions decreases tropospheric OH, which in turn increases the lifetime and therefore the methane burden
CH4 sinks do not discriminate between different kinds of methane, be it natural or anthropogenic. They do not even have the information. We equally lack information because we do not really know what happened in the past. What we can do is trying to monitor methane lifetime at current concentrations, and that is reality, instead of a fictional enhanced lifetime.
CH4 and Ozone
Figure 6.12 in AR6 illustrates how methane is the primary source of the GHG ozone, see below. Inevitably we need to discuss ozone as well at this point. Predominantly ozone is absorbing UV in the stratosphere, thereby heating it and being largely responsible for the specific temperature profile. The general assumption here is that stratosphere and troposphere (and the surface with it) would move in opposite directions, when it comes to temperature. If something warms the stratosphere, like volcanic aerosols, the troposphere cools. If on the other side there is something cooling the stratosphere, like WV injected by the Honga-Tonga volcano, that would warm the troposphere.
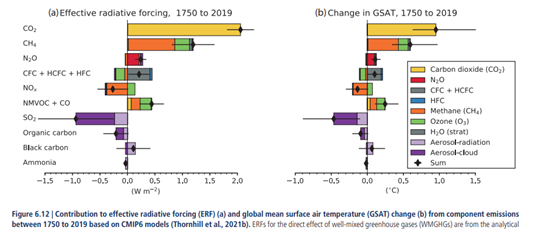
I strongly doubt this automatism actually exists, but that is another story. As we all know halogens (being GHGs on their own right) caused a reduction of stratospheric ozone, leading to the famous “ozone hole”. If you look at the chart you will see a section of chlorine and fluorine compounds (halogens, or “CFC + HCFC + HFC”) that have a negative effect on ozone forcing. So the “ozone hole” is meant to be a negative forcing, cooling the Earth, or should I say the troposphere, as opposed to the stratosphere.
This is remarkable! As Halogens are reducing stratospheric ozone you would expect cooling up there and warming(!) of the troposphere. Yet the IPCC claims the opposite. I mean one could imagine these substances to reduce tropospheric ozone as well, which would indeed mean a negative (indirect) forcing, but that has actually gone up. But ok, it gets even weirder.
Methane now is supposed to be the main source of ozone positive forcing. This is questionable on its own right, since CH4 evidently has no oxygen in it. To produce ozone you will need O2 and a free oxygen atom, plus some energy. That oxygen atom will certainly not come from CH4. Hydroxyl (OH) compounds however have an oxygen atom and as they interact with CH4, this might be the source. The problem is just, hydroxyl loves to react with almost anything around anyway, CH4 is not causing its reactivity.
Instead there is a far more evident and reasonable link, the IPCC even names:
Ozone-depleting substances, such as N2O and halocarbons, cause a reduction in stratospheric ozone, which affects ozone and OH production in the troposphere through ultraviolet radiation changes (and thus affect methane).
It is incredibly simple. UV radiation causes the formation of ozone in the first place. If there is less ozone in the stratosphere, more UV radiation makes it into the troposphere and eventually also onto the surface. Because of it, ever since the ozone hole became a known issue, we were told to be extra careful and use sunscreen. Obviously as more UV gets through to the lower layers of the atmosphere, of course this will produce more tropospheric ozone there. And this is not just a theoretical consideration, rather the empirical data show tropospheric ozone went up as stratospheric ozone went down. And as halogens became largely illegal, both of which stabilized, despite still increasing methane levels16.
Also we know how ground level ozone quickly builds up during sunny summer days, especially in cities. Therefore it is easy to tell the main drivers, which are sun light, UV specifically, and yes, pollution (NOx) will also play a role. Methane, as a yet relatively long lasting GHG, however is NOT concentrated in cities. It remains completely mysterious how methane should indirectly be responsible for the bulk of ozone forcing. I can not rule out some interaction here, but we know the main culprits and methane is not one of which.
Beyond this, the quote above suggests stratospheric ozone, or the change of which, will also affect methane. I assume what they mean is more UV in the troposphere should also cause more hydroxyl compounds, reducing the lifetime of methane, potentially.
Anyway, these examples are just meant to show how you could argue just endless and ever more complex interaction loops, eventually going nowhere. It is applied chaos theory where a butterfly stroke in Australia could cause a Hurricane in the Gulf of Mexico, or whatever. Reasoning becomes so arbitrary you could argue anything. With everything interacting, just emphasize those causal relations you like, downplay or ignore those unfavourable to your cause, and you have the recipe for science fiction. With science however, it has little to do. It is a far more rigorous discipline.
The CH4 forcing potential
The deeper you dive into that matter, the murkier it gets. It is kind of weird to read about all these different considerations on what might be the right metric, what interactions might not all be considered and so on. Balcombe et al for instance names no less than 12(!) different metrics by which the climate effect of methane could be calculated. Forcing potential is one thing, but what about the “technology warming potential”, the “global damage potential”, or the “social cost of methane”? Each of which can be modelled and discussed seperately. It is easy to see how this essential research could keep our best (tax financed) scientists entertained for decades to come. Only evil people would call this a sort of self-employment driven by some mental methane.
To get anywhere, we will have to straighten things up a bit. You start out with the initial forcing, allow for the decay over time, add the forcing by CH4 converted to CO2. That would be the numerator. The denominator is not just instant CO2 forcing, but instead its decay, or rather CO2 sinks, will also be considered. To quote Balcombe et al 2018:
In comparison, the lifespan of CO2 is more complicated due to the different mechanisms that take CO2 out of the atmosphere, but 50% of a pulse emission is removed from the atmosphere within 37 years, whilst 22% of the emission effectively remains indefinitely.
To many laymen, getting their “climate science” from the media or activists, this may come as a little surprise. You may have heard CO2 would stay around for thousands of years or so. If you google “how long does co2 stay in the atmosphere” the first result will be NASA17, stating “between 300 to 1,000 years”. But that is not really what scientists think, rather it is just meant to misinform the public. Also it is questionable if 22% would stay around forever, as there are huge reservoirs of carbon that atmospheric CO2 “communicates” with in the long run. But either way, in general the 37years of half life for CO2 seem quite accurate, but if anyone says that in public, beyond the “safe space” of scientific papers, he will be “climate denier”. The cherry on the cake however is, whenever the great forcing potential of methane is named (arguably to scare people), that is an implicit reference to the still relatively short half life of CO2 in the denominator. People do not know that and they are not supposed to, but they should.
Anyway, using the plain vanilla approach it is not hard to calculate the “global warming potential” of methane relative to CO2. First of all said 0.38W/m2 are only 78times the marginal CO2 forcing (@400ppm btw) based on the “flux” approach. Generously assuming one kg of CH4 converts into 2.4kg of CO2, with an 11% decay rate over 20 years the forcing potential of methane will be 38. And over a 100 years GWP will still be 16 (+/-1), depending how exactly you deal with the alleged forever-lasting CO2 part.
In general it is just about half the figures given in the literature. Do not get me wrong, I am not saying this was the only truth. But it is what you get from let us say tangible evidence, as opposed to ever more esoteric alleged interactions.
Cows are barely the problem
An average adult cow may emit about 100kg of methane a year. Current livestock of cattle amounts to just over 1.4 billion. A simple multiplication thus suggests the global cattle population will emit about 140 mio tons. In reality this figure should be lower, as a decent fraction will be calves and the 100kg are just a very rough average. In figure 5.14 from the AR6 above, the IPCC estimates some 110Mt from all lifestock, which seems reasonable. That is about 17% of total emissions.
It follows that all lifestock combined would add, or rather maintain a contribution of about 350ppb to atmospheric methane levels. And this difference means a (direct) forcing of 0.14W/m2, roughly two times the official forcing by aviation induced cirrus (forgetting their dominant impact in reality), let alone aviation related CO2 emissions. It is an interesting question on its own right. I mean what is more important, flying around, or dairy products and meat? And then please add the perspective of private jet using climate activists arguing lifestock was the problem. You can’t make this up..
Still even then this “lifestock forcing” (lol) is rather exaggerated. For instance, in North America today, there are about 100 mio cattle and about 30.000 bison (or maybe 300.000, depending on the criterion of “purity”, as most are cattle hybrids). Before Columbus there were no cattle, but about 60 mio bison. So yes, mankind made a huge difference there and in a way it is not beautiful. However, the biological concept of ruminants eating grass and burping methane was not invented by humans and it is not an artificial thing. If it was not for us, there would still be significant emissions from that natural source. Considering our lifestock management only gradually increased ruminant methane, this pivotal source of food produces even less warming than aviation. Again, mind your priorities!!! The idea of abandoning cattle for the benefit of mankind is akin to hammering a nail into your knee to fight a headache. The remedy is a hundred times worse than the (non-)problem.
But even this comes with a little side show. To quote Stoy et al 202118:
American bison (Bison bison L.) have recovered from the brink of extinction over the past century. Bison reintroduction creates multiple environmental benefits, but impacts on greenhouse gas emissions are poorly understood. Bison are thought to have produced some 2 Tg yr−1 of the estimated 9–15 Tg yr−1 of pre-industrial enteric methane emissions, but few measurements have been made due to their mobile grazing habits and safety issues associated with measuring non-domesticated animals.
When we sum the observations over time with conservative uncertainty estimates we arrive at 81 g CH4 per bison d−1 with 95 % confidence intervals between 54 and 109 g CH4 per bison d−1
Per bison they suggest 81g of CH4 per day, or 30kg per year (=0.081*365). Bison are basically just wild cattle, comparable in size, able to cross breed, with obviously a similar if not identical digestive system. If a cow emits like 100kg per year, why would a bison, way more active, only emit 30kg? Also it looks pretty odd the American bison alone was responsible for about a sixth of global methane emissions. Although the North American continent indeed accounts for about one sixth of the land mass (including Greenland), there were plenty of other ruminants there as well, like ~30 mio pronghorns, moose, deer, whatever. The 9-15Tg / year (some might say 9-15 Mt) figure might seem more reasonable for North America alone.
There is another problem on top of that. As explained above, the relation between emissions and atmospheric concentration remained pretty constant, despite the claim of methane sink depletion. This makes no sense, and that is ignoring all the uncertainty over these numbers. “Climate science” could overcome the inconsistency by acknowledging a good part of lifestock emissions previously happened naturally. The anthropogenic addition then would be a lot smaller and the yield in elevated atmospheric concentration relatively higher, thereby supporting the theory of self-enhancing lifetime.
But then “anthropogenic” lifestock emissions would be a far lesser issue and that would undermine the “become vegan or eat bugs” agenda. The point is, you can not have it both ways. Even a politicized “science” should have some consistency to keep up the appearance.
No apocalyptic tipping point
Still, on top of all that, there is the threat of tipping points and unprecedented releases of methane? On the ocean floor there are an estimated 2,000 gigatons of methane in the shape of methane hydrate, with a large margin of uncertainty. This figure excludes the large share of water within methane hydrate btw.
If this methane was all of a sudden released into the atmosphere, it would suffice to push its concentration up to 700ppm, opposed to the 1.9ppm we have today. To anyone barely informed, this must sound like a total disaster just waiting to happen. 700ppm is more than the CO2 we have in the atmosphere. And then if methane 80times as bad, that would make it an absolute extinction level event. Alternatively if even fraction of that should happen, we would be doomed anyway, right?
Relax! If you made it so far, you should already know why this is not a real threat. First of all, this is a completely theoretical consideration impossible to occur. Even the IPCC in AR6 suggests the chances for at least fractional amounts to be released being “very low”.
Emissions from subsea and permafrost methane hydrates are not expected to change substantially in the 21st century19
But even following that fiction, at 700ppm methane would provide a direct forcing of 11W/m2, again far less than CO2 does already, because methane is simply a lesser GHG. But that is just the total, the net gain then was a somewhat less 9.5W/m2, enough for 2.6K forced warming. Add feedbacks on top of that as much as you like, it would still not suffice to put the planet in serious trouble. Earth like “been there, done that”. Sure, activists might find many creative ways to still make it a doomsday scenario, no matter how impossible and fictional it is, just based on “could be”. But again, that is fiction, not reality.
The point is, there is no justified scare mongering over methane reservoirs. They might play a certain role in the bigger context, lots of it is uncertain, but it is definitely just marginal. There no need to worry, but if someone plays that card, know where they come from.
Discussion
Sorry, I know, these were far too many details, and yet not nearly enough. There are two opposing principles. The one is rationality, the desire to break down things to a comprehensible level to promote understanding. The other one is bureaucracy that wants to inflate. I have seen that before, many times over.
In “climate science” interactions are an endless source of complexity demanding research, and demanding research funds furthermore. A lot of basic things far more vital and important, are getting pushed aside, just because they are inconvenient. And that is how you end up with stuff like this. There is an endless stream of theory building to maximize the climate effect of methane, apparently just because it shall be the next big thing, next to CO2. Going down this rabbit hole you can virtually smell the odor of politics and special interests playing into “science”.
The most pointedly allegory is the story I already told between the lines here. Bad science meant to extrapolate a large impact of methane on the all so important climate was put on steroids. Despite the vagueness of such “global warming potentials”, only meant to be possibly discussed in the highest and formidable circles of an “elite science”, they got widely communicated in the media as a solid matter of fact. Taken for real and out of context, this inspired a wikipedia author to derive methane forcing from the nonsensical figures on CO2 already there. This garbage was then up on wikipedia for no less than 16 years and became itself the source for “climate science” and educational material. The cycle of stupid!
Summary
I know, this became a somewhat lengthy article, after I shortened it substantially. In the beginning I pointed out there is very little accurate information out there on methane, but now I know why and so might you. The “scientific” stance on the role of methane in climate is just horribly convoluted and it takes some masochism to work through this. And certainly there would be many more papers to read and theories to evaluate. No wonder no one wants to take it on “critically”.
The satisfying part is, that the effort was not in vain and hit the ground already. Especially the issues with “self-enhancing lifetime” and putting the blame for ozone on methane, are just way over the top. Like with almost any aspect of “climate science” we have serious blunders in the core, combined with a horrible inadequate communication via the media.
By any measure methane is a far lesser GHG than CO2. Only with a highly creative line of reasoning, around numerous corners, one could construct kind of a circumstantial perspective where the opposite is true. In “climate communication” this absurd perspective became the only “truth”. It became “truth” because it was and is repeated over and over unless every Pavlov’s human knows the trick. The simple things, you know.
4AR6 WG1 p.302
5https://de.wikipedia.org/w/index.php?title=Treibhauseffekt&oldid=236576162#Treibhausgase
(for some reason I can not link old wikipedia entries directly. The links are correct, but if you click on it, an "amp;" gets added automatically and you will get the current entry. Copying the link however works)
(for some reason I can not link old wikipedia entries directly. The links are correct, but if you click on it, an "amp;" gets added automatically and you will get the current entry. Copying the link however works)
10AR6 WGI p. 836
19AR6 WG1 p.737
Comments (1)
David Hamilton Russell
at 05.07.2024CO2 provides zilch back radiation in fact (on the order of 0.13W/M2 at today's concentrations) and given that, any amplification by WV is negligible.
AGW is just a fraud.