Contrails – the Basic Physics
I know focusing on contrails as the main cause for global warming may look a bit strange to most people. Are they not reflecting sun light? Should that not be cooling the planet? And even in the scientific literature, although by now it is consensus new they have some warming momentum, this was quite disputed for a long time. However, if you understand the basic physics of the GHE correctly, and there is a lot of confusion out there, then contrails are a logical subject of interest.
As with any component of the atmosphere, there are two sides to be considered. That is a) the SW- and b) the LW effect. As contrails are artificial cirrus clouds, they largely behave very similar as their natural counter parts. The only exception would be fresh, possibly short lived contrails, which consist of very small ice particles and are of minor importance. The longer they persist, the more the particle size will grow and the less distinguishable they are from natural cirrus, apart from circumstantial evidence or their macroscopic shape.
1. The Albedo Side
With regard to a), the SW- or albedo effect of contrails, it is crucial to know cirrus or ice clouds are far less reflective than water clouds. As always there are circulating different data on the subject and I can not endorse one specific claim. Yet there is a consensus, which I will not dispute, of ice clouds having only a moderate impact on the albedo. Below there is an excerpt from eumetrain.org1, a “training program sponsored by Eumetsat”.
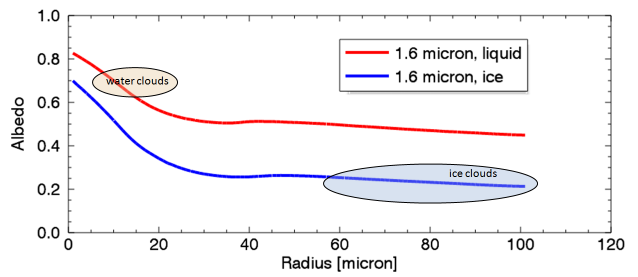
Figure 2a: 1.6 micrometer simulated thick cloud reflectivity as a function of effective cloud particle size for water (red curve) and ice (blue curve) elements. The ellipses represent the typical range of water droplet and ice particle sizes.
(Courtesy of Ralf Bennartz, University of Wisconsin)
A wavelength of 1.6 micron is an extreme example and does no way represent the whole spectrum. Since ice clouds and fallen snow consist of the same raw material, ice crystals, they should arguably have the same or similar optical properties. And despite we all know snow is white, thus highly reflective, we only see a part of the spectrum of sun light. In the near IR snow becomes very “dark”, absorbing most light, rather than reflecting it.
The different sources point to an overall spectral albedo of about 0.523, opposed to some 0.7 with water clouds. Reflecting 50% of sun light may sound like a lot, but remember the albedo of Earth is already at 0.3. If opaque ice clouds covered 100% of the model sky, they would reflect another 20% of 342W/m2 TSI, or 68W/m2. That is a figure we are going to put into perspective.
If your understanding on clouds ends with “clouds reflect sun light and thus are cooling”, that would be a good point to reconsider. As ice clouds are not too reflective and we need to consider what this will mean in different environments. For instance, if there is an otherwise clear sky and the surface is dark (like water or vegetation), then cirrus clouds will increase the albedo and have a significant cooling effect in the SW range. But that is only one scenario.
Alternatively the surface can be highly reflective if it is covered by snow. In this instance, despite clear skies, cirrus clouds would hardly increase the albedo at all. Eventually we need to consider water clouds. Whenever ice clouds are layered above them, they will actually decrease the albedo and thus exert a warming effect already in the SW range.
This should be equally true for contrails. The only difference is ice particles within contrails are initially very small and have accordingly higher albedos. As such fresh contrails are slim, they will only cover a tiny fraction of the sky, making them insignificant. If contrails prevail however, the particle radius will grow over a matter of minutes to hours and then imitate natural cirrus.
2. The GHE
The even more interesting and also intuitive part comes with b), the LW effects of high altitude ice clouds. It is here where a proper understanding of the GHE helps a lot and will bring contrails onto the center stage. As explained many times over, emissions depend on emission temperature (next to emissivity), and within the atmosphere, the temperature depends on altitude.
Let me illustrate this based on a typical atmospheric temperature profile, where we have 288K at the surface, but only 216.8K top of the troposphere (TOT) and within the tropopause, with a lapse rate of 6.5K. It is essentially the US std atmosphere profile from modtran. As emissions = temperature^4 * 5.67e-8 * emissivity, emissions will not just drop with altitude, but do so much faster than temperature. If we assumed perfect emissivity throughout, that would be 390W/m2 with the surface, but only 125W/m2 TOT.
As we see in the chart below the red line, representing an emissivity of 1, crosses the Earths energy budget of about 240W/m2 just above 5,000m altitude. In this way one would tend to assume an average emission altitude of about 5km. To quote Clive Best..
For the Earth (with an albedo of 0.3) it is about 255 K. The effective emission height is the height in the atmosphere at which the temperature matches this temperature. In the Earth’s atmosphere it is at about 5km.4
Of course this is a bit simplified as the stratosphere and its share in emissions is getting ignored. However a more important imprecision is due to assuming perfect emissivity. We know surface emissivity is only about 0.91 and so at sea level emission will rather start at 355W/m2. Regrettably there is little information on the specific emissivities of various GHGs and clouds. It is safe to say these emissivities will be less than 1, but I can give no (exact) numbers here. Anyway, the blue curve will likely be more realistic, suggesting an effective average emission altitude of only 4.000m.
What the chart instantly tells us is, the higher the emission level, the less emissions, the stronger the specific GHE or forcing respectively. If there was a layer very close to the surface, ground fog for instance, it would hardly cause any GHE. The emission temperature and thus emissions would stay almost the same. Btw. that is despite such a layer could absorb all “upwelling” radiation from the surface and “radiate back” about just as much. Again, how much radiation GHGs absorb or “radiate back” is totally irrelevant.
If however you wanted to minimize emissions and maximize the GHE, you would need to push the emission level just above 11.000m in the specific example. There, if we follow the blue line, emissions are only 114W/m2, or 126W/m2 less than the average 240W/m2 - a lot of forcing potential. Or alternatively, by every percentage point cirrus clouds effectively cover this altitude, you get a LW forcing of 1.26W/m2.
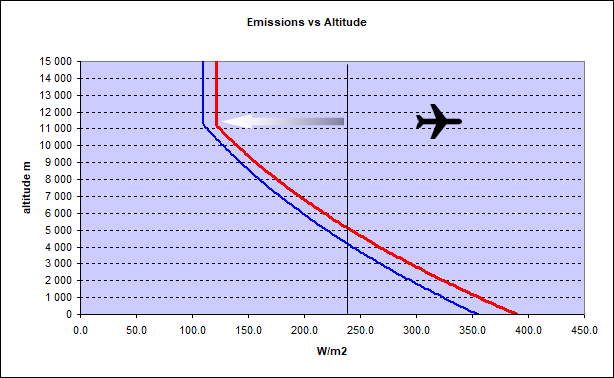
Incidentally this is exactly where airliners fly. Just above the troposphere there are less vertical winds making the flight smoother and safer. With tropical conditions however the typical flight altitude can not always avoid weather systems, which has contributed to some disasters, like Air France 4475. Technically, or aerodynamically, an altitude of 10.000 to 12.000m is ideal for subsonic jet aircraft. Already the earliest of its kind, the British Comet, operated there and not much has changed over the decades.
Different aircraft prefer different altitudes. Not specifically important, the supersonic Concorde flew well above 15.000m, thereby not producing contrails at all. On the other side propeller aircraft, that is even modern turboprops, hardly exceed 8.000m and thus equally avoid contrail formation. Apart from WWII military aviation, contrails are typically related to the subsonic jet airliner that was introduced in the 1960ies and ran into ever larger numbers since then. It is an important detail we are yet going to discuss.
The NET effect
Comparing SW to LW effects of (matured) contrails side by side, it becomes obvious how the LW component will necessarily dominate. With the named examples it would be -68W/m2 in SW vs. +126W/m2 in LW forcing, or 58W/m2 net if the sky was completely covered by opaque cirrus clouds, or well aged contrails respectively. Of course this is a completely theoretic consideration never to materialize. Or as with Meerkötter et al (1998):6
The net radiative forcing grows linearly with τ for small values of s but soon approaches a maximum of about 60 W/m2 near τ = 3
The merit of it is, that now we only need to consider what fraction of the sky may be covered by contrails, then multiply the figure above with it, and already we have an estimate on the actual forcing. I will serve an example below.
Tau - FYI
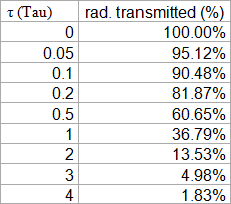
Although it is just a technicality, let me please explain it. Cirrus clouds are almost always optically thin, meaning they have a Tau (τ) of < 1. τ as optical depth is the power of the term 1/e, with e being Euler’s number (2.71828..). A τ = 1 would mean (1/2.71828)^1 = 36.7% of radiation is transmitted, and 63.3% absorbed. With any τ < 1 transmission will be larger, and with any τ > 1 it will be less. The table below gives a couple of examples.
Contrail Aging
One common misjudgement is about the amount of water emitted by aircraft. And just for clarity, the exhaust consists of two major components, CO2 and H2O. Despite the atmosphere being thin and dry at flight level, it still contains far more water than aircraft emit. From this perspective those emissions should be negligible, which brings up the question why contrails then even exist.
Obviously the little amount of water is highly concentrated right behind the exhaust, which combined with rapid changes in pressure (due to turbulences) and temperature, plus some aerosols, set up a perfect environment for the formation of ice crystals. This is specifically obvious with short lived contrails. Despite environmental conditions totally unsuited to maintain ice crystals, let alone their formation, they are yet forced into existence momentarily.
With more favourable conditions something else happens. Not just will the ice crystal prevail, but they will quickly start to grow. And this growth is not because these crystals would “clot together”, but rather it is ambient water condensating on them. The initially just small crystals thus serve as condensation nuclei.
When the contrails are about 1 minute old, the mean particle radius is around 2 μm and increases up to 4-5 μm after 3 minutes.
When contrails persist, the particles typically grow to lengths from 30 - 1000 μm, sizes usually associated with natural cirrus clouds.
Because the crystals grow by deposition, the amount of ice water in the contrail increases until the particles fall out or equilibrium is reached..7
Also Schumann et al (2015) is an interesting read in this regard8. As if the title (“Dehydration effects from contrails in a coupled contrail–climate model”) would not say it all, it suggests “The mass of water in aged contrails may exceed 10e6 times the mass of water emitted from aircraft”. In words, contrails may contain over a million times more water than was originally emitted by an aircraft.
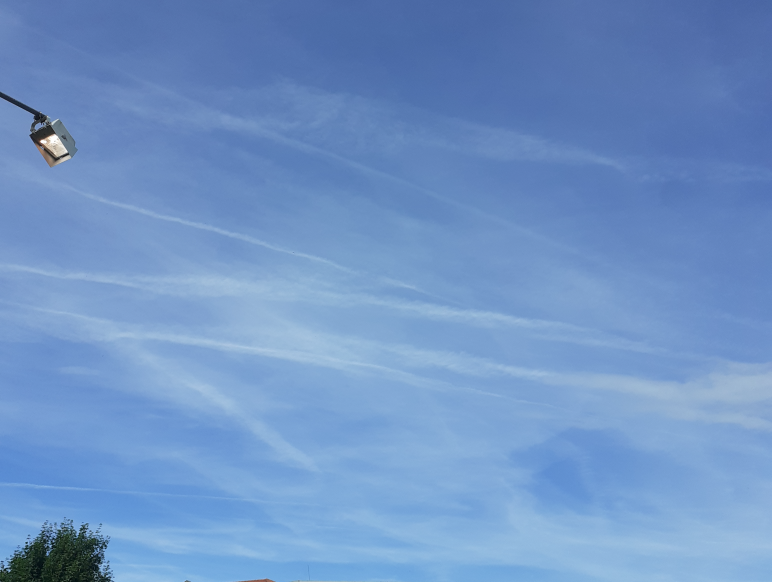
This coincides well with what we see. A fresh contrail will appear very slim and has a certain optical depth. Often there will be older, spread out contrails nearby. If you compare then side by side, the older one seems to hold way more ice. If you would only spread the original slim contrail you should expect a sharp drop in optical thickness, which does not really happen. The reason for it is the growth in particle size.
A Showcase with Modtran
Also with modtran it can easily be shown how sensitive the climate is to cirrus clouds. Let us use the standard U.S. atmosphere model with well mixed GHGs, but without clouds. Then emissions would be 267.842W/m2 TOA. If we add the “Standard Cirrus Model” to it, emissions drop to 249.222W/m2, or 18.6W/m2 less. It would take 4.78K of warming to compensate just for this forcing. And although simplified and just schematic, it already points out a huge forcing. Let us discuss it in detail.
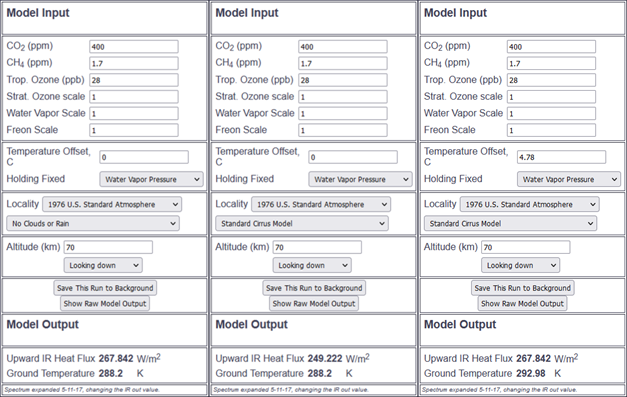
Within this modtran example the cirrus clouds have an altitude of ~11km and a temperature of ~220K. Emissions there should be 220^4 * 5.67e-8 = 132.8W/m2, or 135W/m2 less than the cloudless 267.842W/m2. As the difference in emissions between the cloudless and the “Standard Cirrus Model” amounts to 18.6W/m2 (= 267.842 – 249.222), cirrus clouds should absorb and substitude about 13.8% (= 18.6 / 135) of all other emissions. In other words, this “Standard Cirrus Model” would be about 86% transparent. This would coincide well with “Raw Model Output” data saying “CIRRUS PROFILE EXTINCT 0.140”, although I am not certain if the parameter actually means what I think. Anyhow, τ must be 0.15 in this instance, as 1/e^0.15 = 0.86. So compared to previously discussed models, the “Standard Cirrus Model” has relatively low optical depth.
I should also note the absence of all other clouds in the model (you can not combine cirrus clouds with others), will overstate the cirrus forcing by about 15%. A good part of the emissions cirrus clouds impair would otherwise not exist in the first place. Excluding the cirrus component, emissions TOA should be just above 240W/m2 in the global average the US std scenario is implicitly meant to portray.
Of course this is only the LW part and as above over half of it would be compensated by the albedo effect. Yet the net forcing would amount to some 7W/m2, still a huge figure compared to the forcing potential of CO2.
Finally..
With all that said we should finally be able to decipher a statement like this from Meerkötter et al (1999):
At the top of the atmosphere, a mean contrail cover of 0.1% with average optical depth of 0.2 to 0.5 causes about 0.01 to 0.03 Wm2 daily mean instantaneous radiative forcing.9
With an assumed net forcing of 60W/m2 for a total cover, we can do the math..
60 * 0.001 * (1 - (1/e)^0.2) = 0.011
60 * 0.001 * (1 - (1/e)^0.5) = 0.024
Although it does not match perfectly, it comes pretty close, given the lack of precision in the quoted numbers. Obviously it will not require a complex computer model to derive such figures, but rather a basic understanding of the physics will do. After all it is just this understanding that computer models get fed with.
Also one could quote Schumann et al (2015)10
Figure 12. Global map of annual mean radiative forcing by contrails (a) SW (mean −0.080 W m−2), (b) LW (mean 0.143 W m−2) in logarithmic color scales.
Do mind the absolute numbers here as it is about the quantity of contrails, and we will deal with it later. The point is rather in the relation between SW and LW effect. About 56% (=0.8/0.143) of the LW effect would be compensated by the albedo effect, leaving some 44% net forcing. With the figures I gave above it would be 54% (=68/126) for the compensation and 46% for net forcing. Again, these are just estimates but they are pretty consistent. Also we can tell Schumann et al 2015 suggests some 0.11% (=0.143/126) average global contrail cover.
Surface Forcing?!
Eventually there is only one problem left, and as so often, it is caused by the “back radiation” fallacy. While by now it is widely acknowledged contrails are warming per se, there is yet another confusing perspective. It is the subject of “surface forcing”. Btw. you may run into this issue on many other occasions.
If you look at it from a “surface perspective”, the SW effect of contrails, or cirrus clouds respectively, does not change a lot. They are still simply blocking about the same amount of sun light, although somewhat less. The SW forcing remains largely the same. With “back radiation” however it is a completely different story. Almost all “back radiation” measured at the surface comes from lower, relatively warm atmospheric layers, as discussed. Putting some extremely cold contrails onto the top of the troposphere will hardly change anything. Due to their temperature they will emit only little “back radiation”, which is almost entirely absorbed by the atmosphere, and never makes it to the surface.
As the SW effect thus far exceeds the direct LW effect of contrails, their “surface forcing” is negative by a large margin. And so, from this perspective, contrails should rather be cooling. Or, integrating both perspectives, they would be warming the Earth as a whole, but cool the surface. Does it make any sense? Of course not11. And since it is not even consensus (anymore), you may want to forget about it anyway. However, if you ever happened to run into the claim of contrails (or cirrus) having a negative net forcing, then remember this is the ill fated reasoning behind it.
Summary
Contrails are not rocket science and you will not need a “computer model” to understand what they are doing. As in any other instance, such a model will only return with what you put into it. Essentially contrails feed from a pool of about 60W/m2 theoretical net forcing, though that figure is negotiable, if they totally covered the average model sky. The actual net forcing will naturally just make up a fraction of this figure, depending on how much of the sky is covered and at which optical depth.
Locally this “base forcing” will depend on a couple of variables, such surface albedo (snow!), the presence of (other-) clouds, or the day-night cycle. Notably the strongest net forcings come from the contrails we can not see, because they are either concealed by clouds or obscured by the night.
Eventually this brings up the question, why there should be a lot of uncertainty over the climate effects of contrails, and why, as I already suggested, I think they are hugely underestimated. However the answers to these questions are another story, or article respectively.
11Although it is irrelevant, the mistake is to only assume the direct change in “back radiation”. Rather it is about a top-down temperature increase, eventually raising “back radiation” as well. Changes in “back radiation” are largely a downstream issue caused by a change in temperature, which is why it can be ignored in the first place.


Comments (0)
No comments found!